Set Notation & Conditional Probability (Edexcel A-Level Mathematics): Revision Notes
3.2.1 Set Notation & Conditional Probability
Notation of Sets
Universal Set
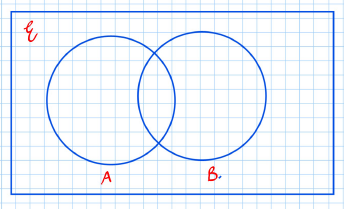
The rectangular boundary represents the universal set, containing all elements under consideration.
Empty Set
The empty set contains no elements, denoted as.
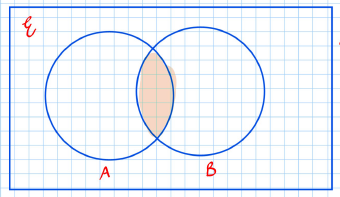
Intersection
- This is the set of elements common to both sets A and B.
- It is represented by the shaded area where both circles overlap.
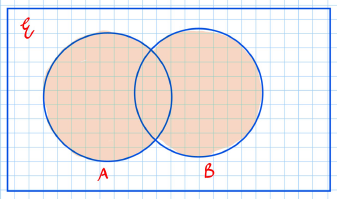
Union
- This is the set of elements that belong to either set A or set B, or both.
- The entire area covered by both circles is shaded.
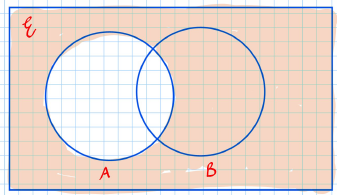
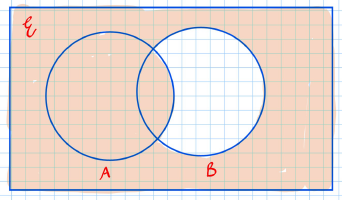
Complement A'
- This represents the set of all elements not in A.
- The entire area outside circle A is shaded, including the area of B.
Examples
Example: Shade Step 1: Shade .
Step 2: Shade .
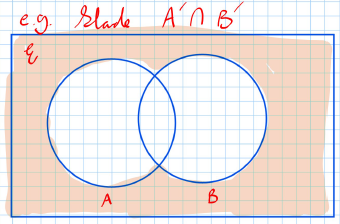
Example: Shade In other words:
Shade the overlapping region of and .
Mutually Exclusive & Independent Events
Mutually Exclusive Events
If two events and are mutually exclusive, this means they cannot occur at the same time, i.e.,
Independent Events
Two events are independent if the outcome of one does not affect the probability of the outcome of the other.
Example: Spinning two different spinners.
The number of elements in a set is denoted or .
Example:
If ,
Worked Venn Diagram Example
Example Question
Consider that
-
-
-
-
Given that:
-
A and B are independent
-
B and C are independent
-
(where B' denotes the complement of B)
Questions:
a) Draw a Venn diagram to illustrate the probabilities.
b) Find:
- c) State, with reasons, whether events and are independent.
Worked Solutions
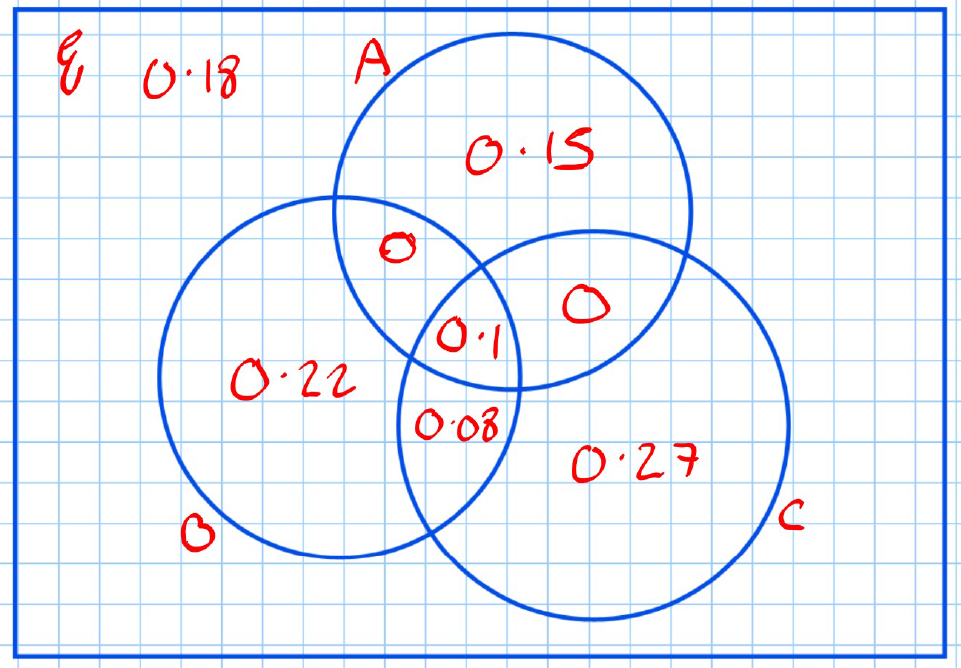
a) Draw a Venn diagram to illustrate the probabilities.
Step 1: The Venn diagram is drawn with labelled probabilities in each region.
b) Find:
Step 1: Understand the Event
We need to find the probability of the event
This represents the regions where the complement of (i.e., everything outside ) overlaps with the union of (the complement of ) and (inside or outside ).
Step 2: Identify the Regions
We break down into the areas covered by (the complement of ) or , then find where this intersects with .
The relevant regions are:
- (outside and outside )
- (outside , inside , and inside )
- (outside , outside , and inside )
Step 3: Add the Probabilities
To find , sum the probabilities of the regions:
Step 4: Calculate the Total
Add the probabilities of these regions:
Thus,
b) Find:
Step 1: Understand the Event
We need to find the probability of
This represents the event where either or occurs (the union of and ) and where also occurs at the same time (the intersection with ).
Step 2: Identify the Regions
To compute this, we focus on the overlap between and the union of and .
This includes two key regions:
- (where all three events occur)
- (where and occur, but does not).
Step 3: Add the Probabilities
We now add the probabilities of these two regions:
Step 4: Calculate the Total
Summing these probabilities gives:
c) State, with reasons, whether events and are independent.
Step 1: Understand the Condition for Independence
Two events are independent if the probability of their intersection equals the product of their individual probabilities.
This means we need to check if
Step 2: Calculate and
is the complement of
Therefore,
We are given
Step 3: Multiply and
Now, multiply the probabilities of and :
Step 4: Calculate
The probability of is found by summing the relevant regions:
Step 5: Compare the Results
Since
Comparison shows that .
Therefore, and are not independent.
Conditional Probability
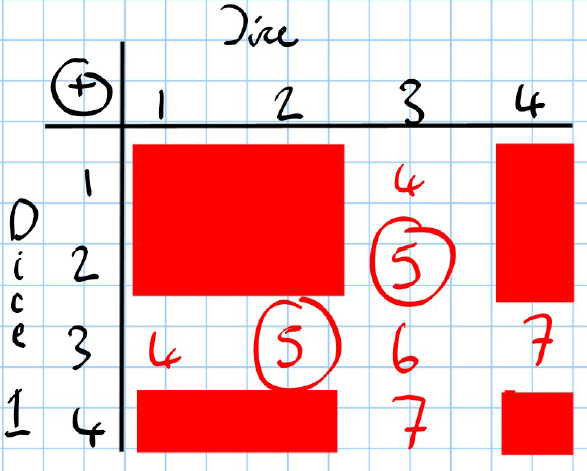
Two four-sided dice are thrown together, and the sum of the numbers shows is recorded
Example Question
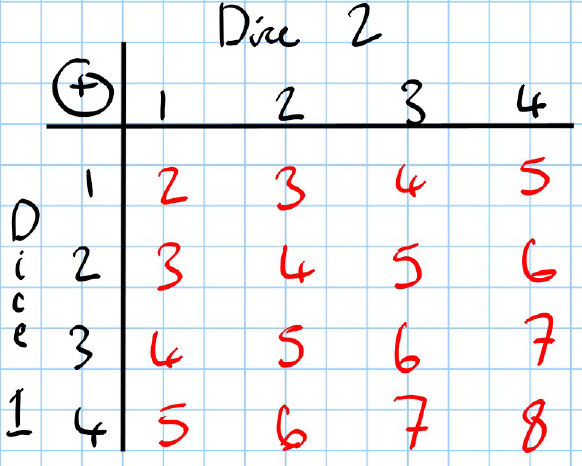
Part (a): A sample space diagram is drawn showing all possible outcomes of the sum of the numbers when two four-sided dice are thrown.
Part (b): Given that at least one die lands on a 3, the probability that the sum on the two dice is exactly is calculated.
Part (c): A modelling assumption used in the calculations is stated.
Worked Solutions
a) Sample Space Diagram:
The sample space shows all possible sums (ranging from to ) for each possible pair of rolls between the two dice.
b) Conditional Probability:
The diagram highlights the outcomes where at least one die shows a , excluding all cases where no are present.
There are 7 possible outcomes remaining, with 2 of them summing to 5.
The probability is therefore .
c) Modelling Assumption:
The assumption made is that the outcome on each die is equally likely, meaning the dice are fair.
Example Question
- A school has students in Year .
- Of these students:
- study only humanities subjects ().
- study only science subjects ().
- students study both science and humanities subjects.
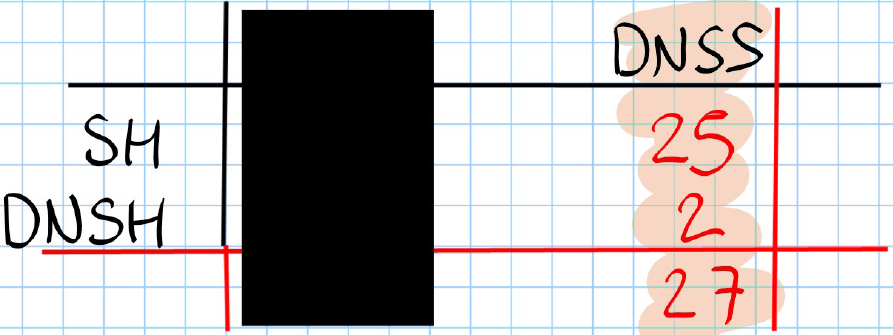
- Students are categorized into those who study humanities (), science (), and those who do not study either ( - Do Not Study Humanities, - Do Not Study Science).
Questions
a) Draw a two-way table to represent this information.
b) Find the following probabilities:
Worked Solutions
a) Draw a two-way table to represent this information.
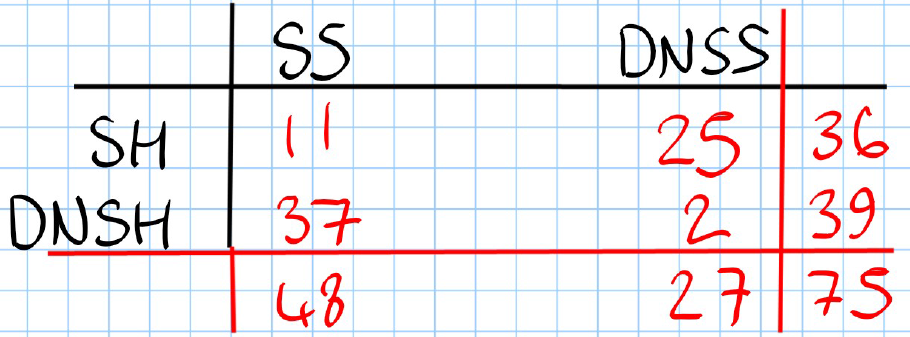
The table is constructed with rows representing whether students study science () or do not study science ().
The columns represent whether students study humanities () or do not study humanities ().
The entries in the table represent the number of students in each category:
- students study both science and humanities.
- study only humanities.
- study only science.
- The total number of students is .
b) Find the following probabilities:
- This is the probability of students who do not study science and do not study humanities.
Using the table
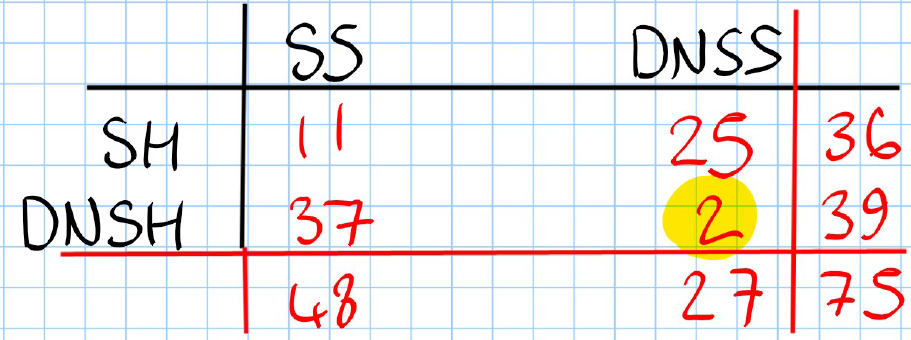
b) Find the following probabilities:
- This is the probability of students studying science given that they do not study humanities.
Using the table
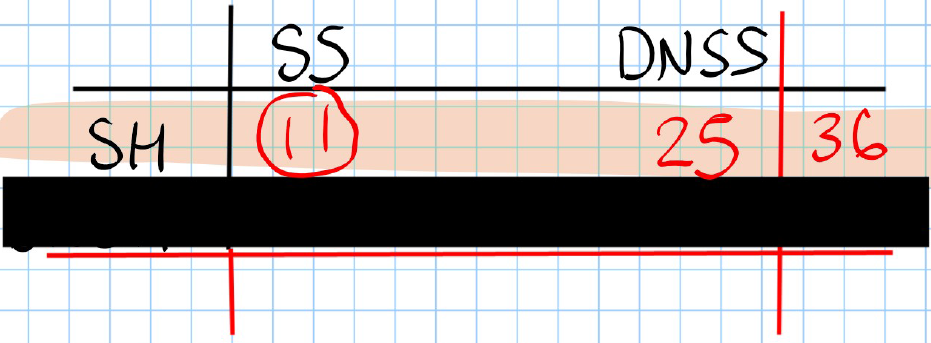
b) Find the following probabilities:
- This is the probability of students studying humanities given that they do not study science.
Using the table