Maths Skills 1 (OCR A-Level Biology A): Revision Notes
Maths Skills 1
Mathematical skills are essential for analyzing biological data and understanding quantitative relationships in biology. This note covers the key mathematical techniques you'll need for A-Level Biology, from handling numbers to creating and interpreting graphs.
Working with numbers
Standard form and powers
Biologists study organisms and structures across an enormous range of sizes—from blue whales weighing to bacteria with masses of . To handle these extreme values, we use standard form (also called scientific notation).
In standard form, numbers are written with one digit before the decimal point, multiplied by a power of ten. For example:
Powers (also called indices or exponents) tell us how many times to multiply a number by itself. For instance, . This concept helps explain the genetic code—with four DNA bases (A, T, C, G), triplet codons provide possible combinations, which is enough to code for all twenty amino acids.
Multiplying numbers in standard form: Add the powers together.
Dividing numbers in standard form: Subtract the powers.
Negative indices are used for very small numbers (like ) and in units instead of 'per' (e.g., instead of cm³ per second).
Fractions and reciprocals
A fraction consists of a numerator (top number) and a denominator (bottom number). Always simplify fractions: .
To calculate a fraction of a number: multiply by the numerator, then divide by the denominator.
A reciprocal is calculated by dividing by a number. For example, the reciprocal of is . Sometimes reciprocals are multiplied by , , or to create whole numbers that are easier to work with and plot on graphs.
Reciprocals are commonly used to calculate rates of reaction, making it easier to visualize and compare reaction speeds across different experimental conditions.
Decimals and rounding
In scientific writing, use a full stop (not a comma) for decimal points.
To multiply or divide decimals:
- Multiply: Move the decimal point right for each factor of
- Divide: Move the decimal point left for each factor of
Worked Example: Decimal Operations
When deciding how many decimal places to use, apply common sense. Don't make results more precise than your original measurements. If you measure time to the nearest second, don't report calculated results to three decimal places.
Rounding rules:
- If the next decimal place is –, round down
- If the next decimal place is or greater, round up
For example:
- rounded to one decimal place = 7.6 (rounded up)
- rounded to one decimal place = 10.5 (rounded down)
Significant figures
Significant figures (sig figs) indicate the precision of a measurement or calculation. All non-zero digits are significant, but zeros have special rules:
- Zeros at the beginning are not significant: has two sig figs
- Zeros at the end of whole numbers are significant: has four sig figs
- Zeros between sig figs are significant: has four sig figs
- Zeros after a decimal point are significant: has three sig figs
When performing calculations, your answer should have no more significant figures than the least precise measurement you used. Don't round until the final step of your calculation.
Calculations—best practices
Always write out all steps in your calculations, even when using calculators or spreadsheets. This approach:
- Helps you think through what you're calculating
- Creates a record for checking errors
- Allows examiners to award partial credit if your final answer is incorrect
Estimating answers: Before using a calculator, estimate the approximate answer by rounding numbers. This helps you spot errors.
Worked Example: Estimating Heart Rate
If an ECG shows each heartbeat takes , estimate heartbeats per minute by rounding to —giving roughly beats. Since each beat actually takes less than a second, there must be slightly more than beats per minute.
The precise answer: .
Units of measurement
Biological measurements use the SI system (Système Internationale). The table below shows the units you'll most commonly encounter:
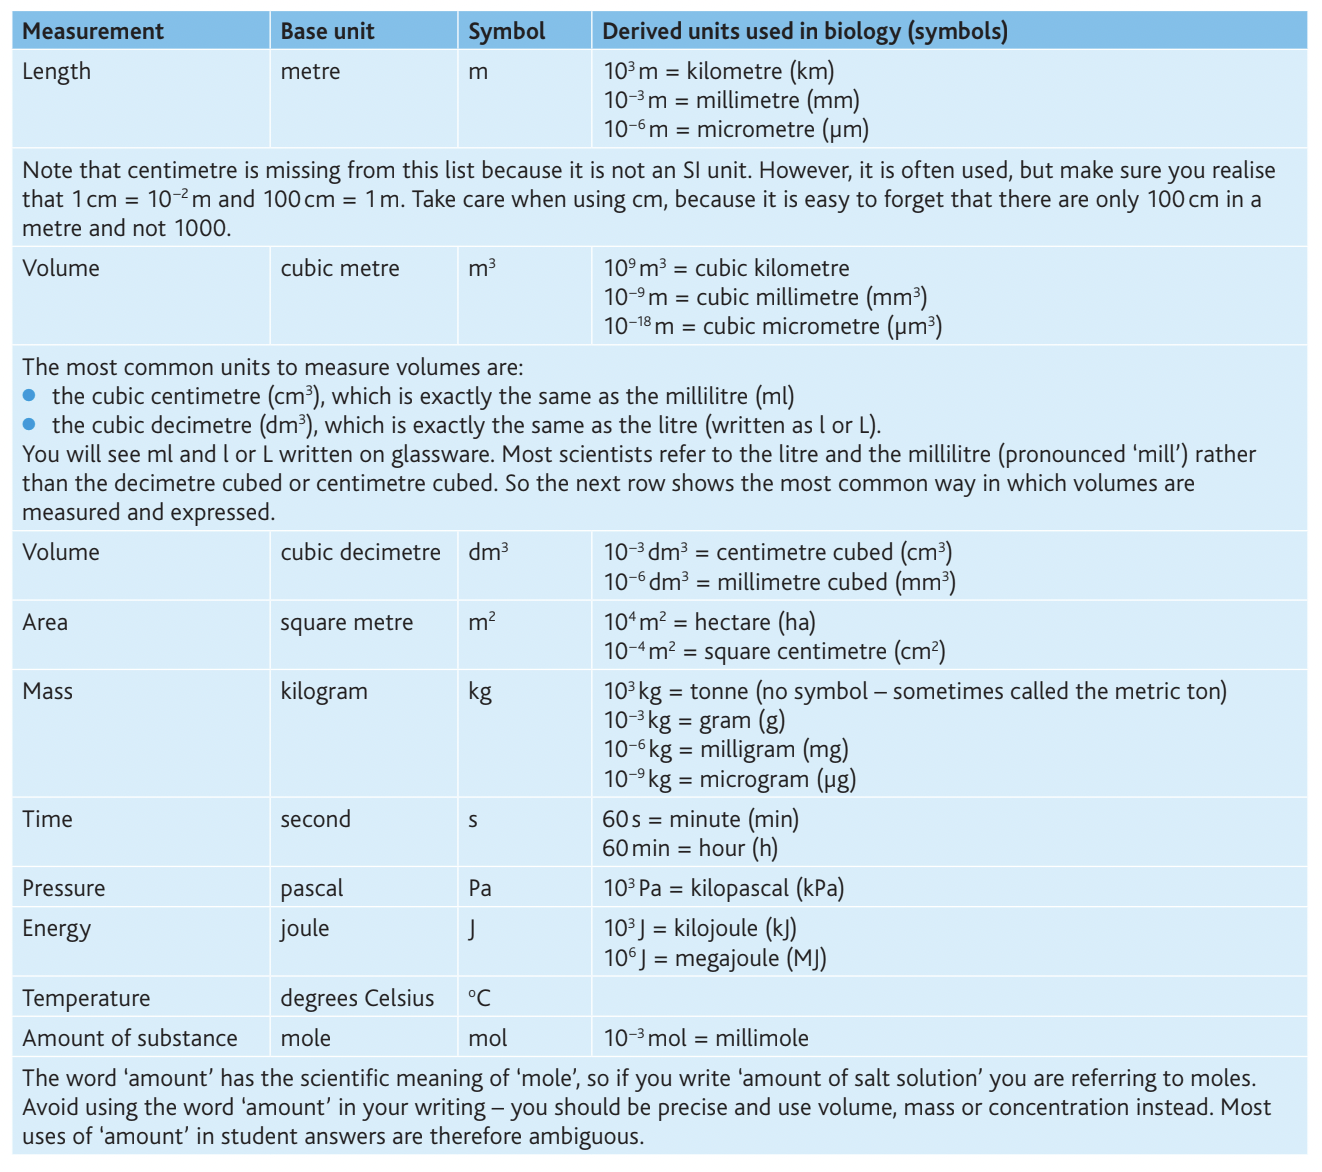
Important notes:
- Centimetre () is not an SI unit, but is commonly used. Remember: and
- Most scientists use litres ( or ) and millilitres () rather than cubic decimetres and cubic centimetres
- Avoid using 'amount' in scientific writing—it technically means 'mole'. Use specific terms like volume, mass, or concentration instead
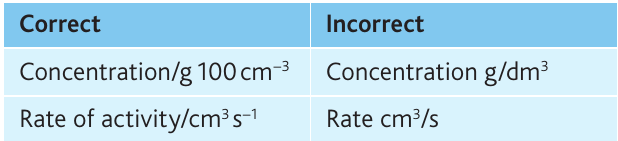
When writing units, never use the solidus (/) to mean 'per'. Instead, use negative indices:
Converting between units makes data easier to read and graph. For example, is clearer when written as , especially when plotting graphs.
Measurements from microscopy
Magnification is the ratio between the size of an image and the actual size of the object.
Key formulae:
Worked Example: Calculating Actual Size from a Micrograph
To calculate actual size from a micrograph:
- Measure the object in millimetres
- Divide by the stated magnification
- Multiply by to convert to micrometres ()
When images include scale bars:
- Measure the scale bar length in millimetres
- Measure the object length in millimetres and divide by the scale bar length
- Multiply by the length represented by the scale bar
Drawings of macroscopic objects often have magnifications less than . For example, a drawing of a heart at half life-size has magnification .
Descriptive statistics
Creating tables
Tables organize data clearly. Follow these rules:
- Plan your table before starting—decide how many columns and rows you need
- Use at least half the available space
- Draw outlines in pencil with a ruler
- Write clear, brief column headings with appropriate SI units
- The first column should contain the independent variable
- Subsequent columns should contain dependent variables
- Arrange the independent variable in ascending order
- Keep entries brief—single words, numbers, ticks, or crosses
- Use the solidus (/) to separate quantities from units in headings (e.g., Concentration/g)
Calculating averages
The term average describes the center of a data range. There are three types:
Mean ()—the arithmetic average, calculated by:
where means 'sum of', is any data value, and is the total number of values.
The mean is best for normally distributed data (bell-shaped curves). Always write 'mean' rather than 'average' to avoid ambiguity.
Median—the middle value when data is arranged in order. For an odd number of values, take the central value. For an even number, calculate the mean of the two central values.
The median is most useful when data is skewed (not normally distributed).
Mode—the most frequently occurring value. Useful for whole numbers (e.g., counting organisms) and identifying the modal class in grouped data. When two values occur most frequently, the distribution is called bimodal.
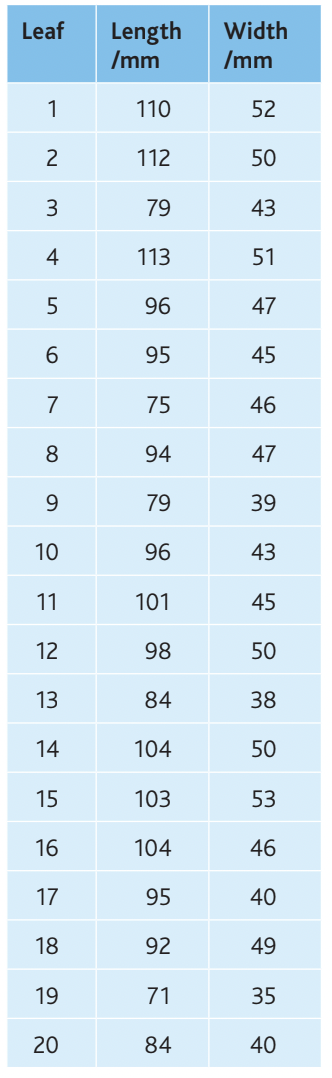
Worked Example: Calculating Averages
Leaf lengths (mm):
- Sum =
- Mean =
- Ordered data:
- Median = 95 mm (middle value)
- Mode = 79 mm (most frequent)
Spread of data
The range shows the spread of results—either as the difference between maximum and minimum values, or by stating both values (e.g., to , or ).
Standard deviation (SD) measures how widely data is dispersed around the mean. It's calculated from the variance:
For normally distributed data:
- of values fall within SD of the mean
- of values fall within SD of the mean
Large standard deviations indicate widely dispersed data, suggesting less confidence in the mean value.
Error bars on graphs can show either the total range or the standard deviation, helping visualize data variability.
Percentages and percentage change
Percentages allow valid comparisons between different totals:
Percentage change compares a change to the original value:
Percentage changes can be positive (increase) or negative (decrease).
Worked Example: Calculating Percentage Increase
A cell culture increases from to cells:
Calculating areas and volumes
Prisms are solid objects with identical ends, flat sides, and constant cross-sectional area. You should know how to calculate surface areas and volumes for cuboids and cylinders. For spheres, formulae will be provided if needed.
Circles:
These formulae are useful for measuring tree growth (circumference) and calculating cell density in microscope fields of view (area).
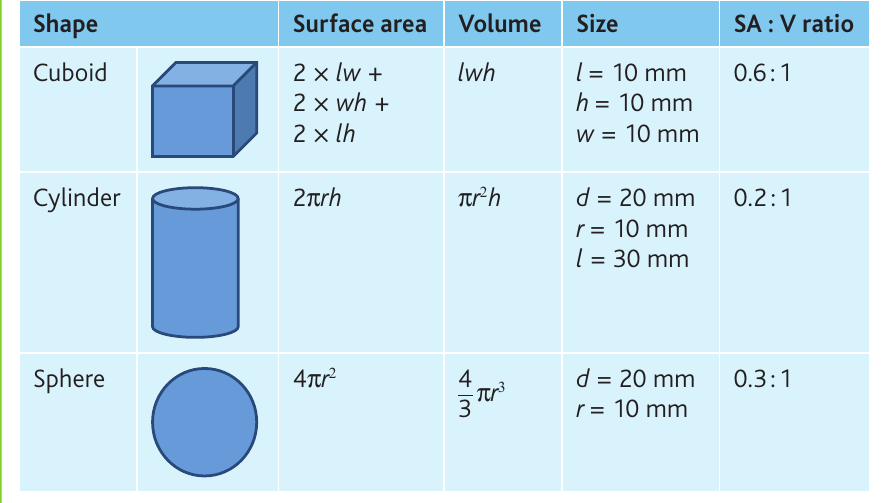
Surface area to volume ratios
Surface area to volume (SA:V) ratios are important for understanding diffusion, gas exchange, and transport in organisms. To calculate:
- Calculate the surface area
- Calculate the volume
- Express as a ratio (e.g., )
Smaller organisms generally have higher SA:V ratios, which affects their metabolic rates and need for specialized exchange systems.
Graphs and charts
Line graphs
Line graphs show relationships between continuous variables. The independent variable goes on the -axis; the dependent variable on the -axis.
Drawing guidelines:
- Use at least half the grid in both directions
- Draw in pencil
- Scale axes using multiples of , or per square—never use multiples of
- Label axes clearly with quantity and units (e.g., Time/s, Concentration/g)
- Plot points clearly using encircled dots () or crosses ()
- Decide if the origin should be included
- Draw straight lines, smooth curves, or point-to-point lines as appropriate
Straight lines should have equal numbers of points on either side. Only draw smooth curves if you're confident intermediate values fall on the curve. Use point-to-point lines if you're uncertain about intermediate values.
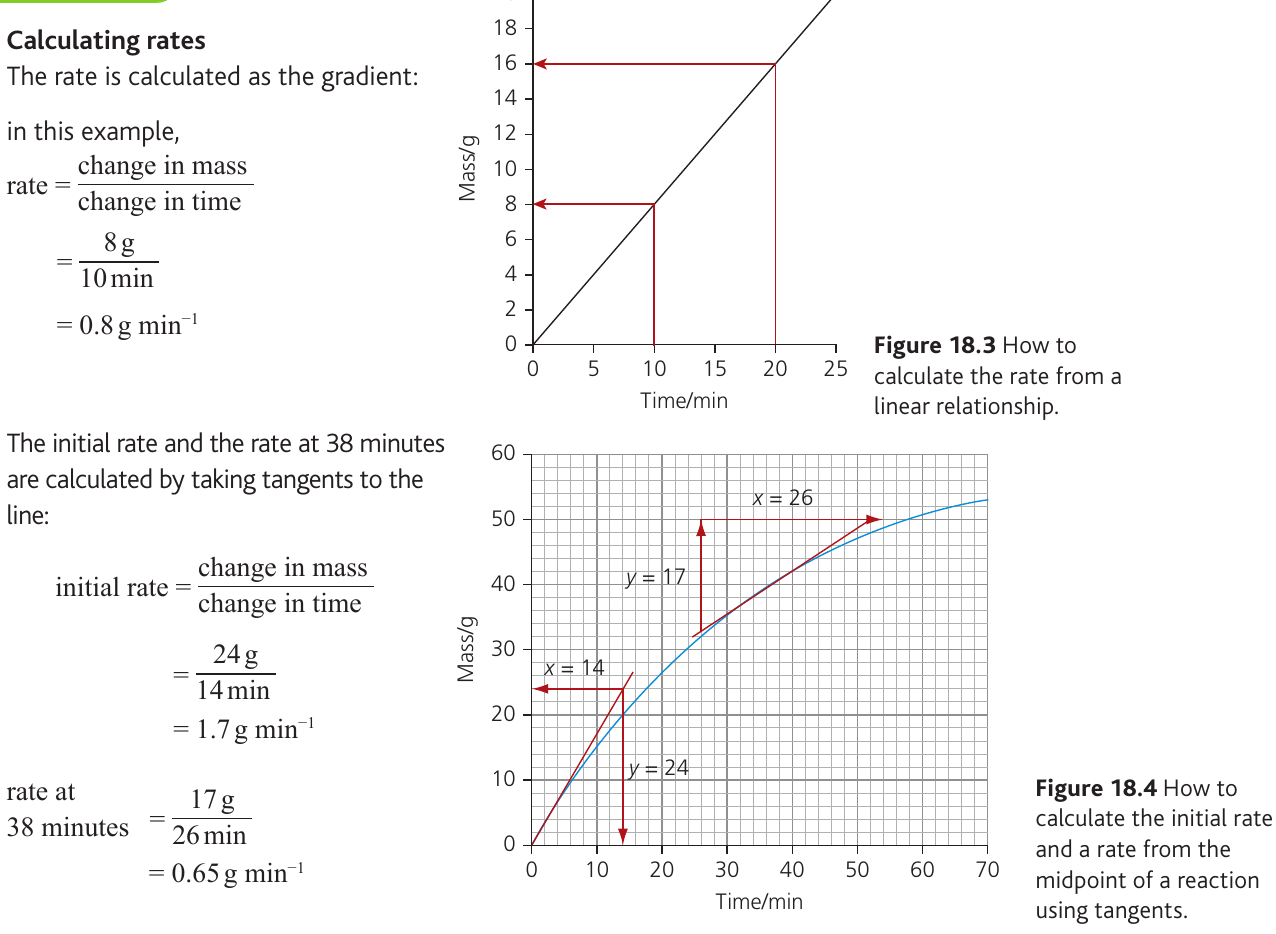
Analyzing graphs
Graph analysis involves:
- Describing the overall trend or pattern
- Providing specific details with data from the graph
- Processing data (calculating rates, percentage changes)
For linear relationships, the equation is:
where is the gradient and is the -intercept. If , the relationship shows direct proportion.
To calculate rates from curved graphs, draw tangents at the relevant points. The gradient of the tangent gives the rate at that moment:
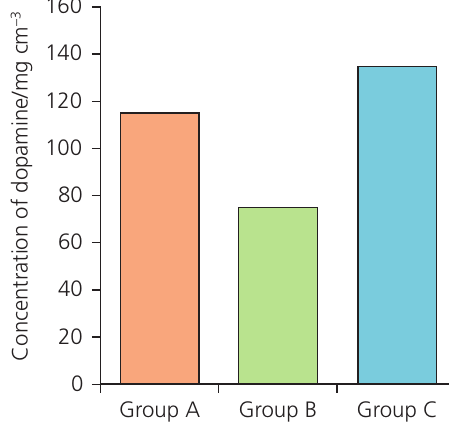
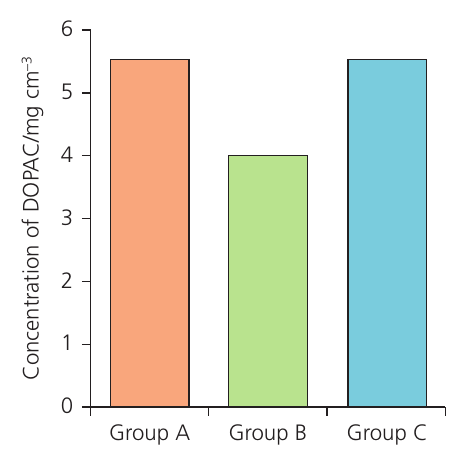
Bar charts
Bar charts compare discrete categories. The blocks:
- Should be equal width and not touching
- Can be arranged in any order (descending size helps comparisons)
- Don't need shading or color-coding
- Should have equidistant spacing on the -axis
Label the -axis with appropriate units and scale it properly.
Histograms
Histograms display continuous numerical data organized into classes (frequency diagrams).
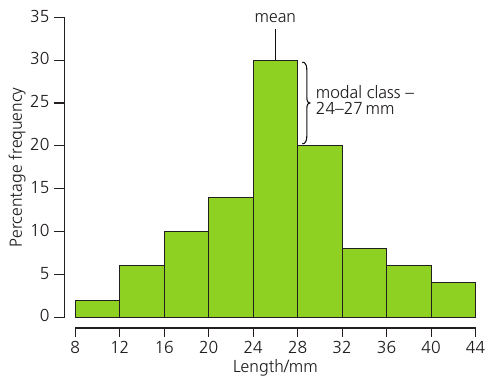
Creating classes:
- Number of classes =
- Range of each class = total range (number of classes )
- Ensure classes don't overlap (e.g., –, then –)
Drawing rules:
- Use at least half the grid
- Blocks should touch (continuous data)
- Block area is proportional to class size
- -axis shows the independent variable (continuous)
- -axis shows frequency or number
- Label blocks clearly (e.g., first block: '–' includes but not )
The modal class is the class with the highest frequency.
Scattergraphs
Scattergraphs reveal correlations between two variables.
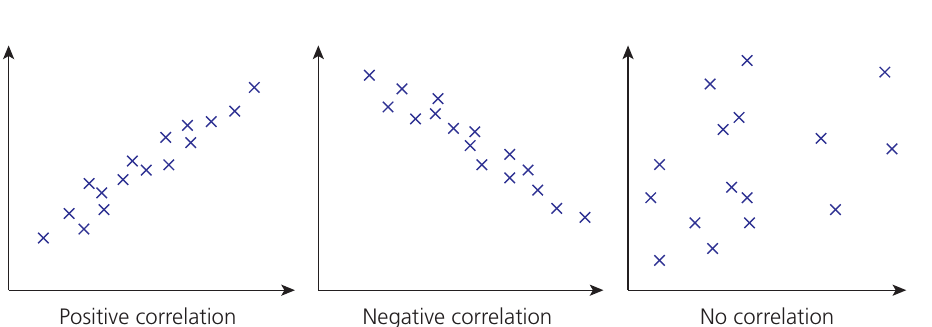
Positive correlation: As one variable increases, the other increases
Negative correlation: As one variable increases, the other decreases
No correlation: No clear relationship between variables
Correlation doesn't prove causation, but it identifies trends worth investigating further through experimental work.
Uncertainty in measuring
Uncertainty is half the smallest graduation on measuring equipment. For example, if a syringe has graduations:
- Uncertainty =
- A reading of is recorded as
If measurements don't start at zero (e.g., burette readings), uncertainty applies at both ends, so it doubles.
Percentage error calculation:
Worked Example: Calculating Percentage Error
Measuring of gas with a syringe (graduations every ):
For , the percentage error would be 5%—larger measurements reduce percentage error.
Remember!
Key Points to Remember:
- Always use standard form for very large or very small numbers to improve clarity and reduce errors
- Write out all calculation steps, even when using calculators—this helps you check for mistakes and can earn partial marks in exams
- Use the correct number of significant figures based on your least precise measurement, and only round at the final step
- Tables and graphs must have clear labels with appropriate SI units—never use the solidus (/) to mean 'per' in units
- Draw graphs in pencil, using at least half the available grid, and choose appropriate scales (multiples of , or )
- Standard deviation and error bars help communicate the reliability of your data—larger values indicate more variability and less confidence
- Surface area to volume ratios explain why small organisms have different metabolic and exchange requirements than large ones