Preparing for Practical Assessment (OCR A-Level Biology A): Model Answers
Preparing for practical assessment
Introduction to experimental biology
Experimental science forms the foundation of modern biology. Throughout history, biologists have advanced our understanding through systematic research and investigation. Notable examples include researchers such as Hershey and Chase, who investigated DNA function using bacteriophages, Meselson and Stahl, who studied DNA replication mechanisms, and Beadle and Tatum, who explored the relationship between genes and proteins.
These scientists followed a rigorous scientific approach that forms the basis of all modern experimental work:
- Investigating existing scientific literature
- Developing testable hypotheses
- Testing hypotheses through experimental methods
It is important to understand that proving a hypothesis conclusively is extremely challenging. Hypotheses can be tested and either disproved or modified, but definitive proof remains elusive. Often, a hypothesis persists until it is either replaced by a better explanation or refined based on new experimental evidence.
Practical studies represent an essential component of biology at all levels and must be integrated throughout any biology course. The practical skills developed at A-Level provide vital preparation for university-level biology and other advanced scientific courses.
Practical assessment requirements
Practical skills are assessed throughout the course in multiple ways. Students must complete and document a minimum of assessed practicals across the two years of an A-Level course in a logbook. These assessed practical activities enable learners to demonstrate competence across a broad range of skills while applying them in real experimental situations. The first year of study builds foundational skills that will be formally assessed during the second year.
Essential practical skills
Planning an experiment
Planning represents a crucial aspect of experimental biology. Begin with thorough research to identify previous studies addressing your problem. This research helps you select appropriate techniques and apparatus for your experimental design. Your selection must be grounded in sound scientific knowledge and a comprehensive understanding of the problem being investigated.
Worked Example: Planning an Enzyme Experiment
When designing an enzyme experiment, you need:
- A solid grasp of enzyme function principles
- Understanding of conditions necessary for enzyme activity
- Knowledge of methods to test enzyme behaviour
This foundational knowledge informs your choice of temperature range, pH conditions, substrate concentrations, and measurement techniques.
Preliminary research and studies
After choosing the most suitable technique and apparatus based on your preliminary research, conduct trial runs or preliminary studies. These trials help identify variables that could affect your experiment, determine how to control these variables, and establish optimal quantities and volumes for completing the experiment.
Why Preliminary Studies Matter
Conducting preliminary studies prevents wasted time and resources. Without this preparatory work, your findings may be invalid, or you might exhaust reagents or reactants before completing the study. Always allocate time for trial runs before beginning your main experiment.
Identifying variables
To ensure your experimental outcomes are valid, you must control any variables that might influence results.
Independent variable: This is the single variable you deliberately change to determine its effect on the results. Only one independent variable should be altered in any experiment.
Controlled variables (also called confounding variables): These are all other variables that must be kept constant or at least monitored to account for their potential impact. You need detailed procedures for controlling these variables consistently and for changing the independent variable systematically. Your method should be sufficiently detailed that another scientist could replicate your experiment identically without requiring additional information.
Dependent variable: This is what you measure to determine the experimental outcome. The method for measuring this variable is crucial, as it reveals how the independent variable affects your results.
Control experiment: A control demonstrates that the independent variable—not some other aspect of the procedure—caused the observed changes. The control eliminates the possibility that changes would occur spontaneously.
Worked Example: Variables in an Enzyme Concentration Experiment
- Independent variable: Enzyme concentration
- Controlled variables: Temperature, pH, substrate concentration, reaction time, volumes
- Dependent variable: Rate of product formation or substrate breakdown
- Control: Repeat the experiment using distilled water (or denatured enzyme) instead of active enzyme
This control confirms that results depend on enzyme presence and concentration, not on other experimental factors.
Evaluation of experimental method
Your experimental design must be evaluated to ensure it properly tests the problem, uses appropriate methods, and will produce expected outcomes.
Limitations: These are fundamental design faults that must be identified and corrected where possible. For example, gas leakage in collection apparatus represents a limitation preventing accurate volume measurement. The required accuracy level must be assessed and improved where possible. This is particularly important when outcomes have significant consequences, such as delivering precise anaesthetic gas volumes to fruit flies for genetic breeding experiments. Incorrect volumes could prove fatal or allow flies to escape during procedures.
Critical Evaluation Points
The precision of apparatus and measuring equipment for the dependent variable must be considered during procedural evaluation. Additionally, conducting an experiment only once cannot assess result reliability. Two different results provide no indication of which is correct. Only by repeating the experiment multiple times and identifying anomalous results can you determine data reliability.
Procedures must be evaluated and improved where necessary. Sometimes evaluation is possible before beginning the main experiment, allowing immediate improvements; other times, evaluation can only occur after completing the experiment.
Record all procedural steps comprehensively to enable other researchers to replicate your work exactly without additional guidance.
Implementing an experiment
Using apparatus and techniques
Understanding how to employ various experimental techniques is essential; some techniques require practice before beginning the actual experiment. Following instructions correctly may seem straightforward, but misreading or misinterpreting instructions is surprisingly easy. Practice following instructions carefully to avoid errors.
Experiments fall into two categories:
- Qualitative experiments: Collecting and recording observations without numerical data
- Quantitative experiments: Collecting and recording numerical measurements
Units and measurements
SI Units in Biology
Use correct and appropriate SI units when measuring substances during procedures and when recording outcomes. You must know the correct symbols for each SI unit.
Key measurement principles:
- Use millimetres () as the standard length unit (not centimetres, which are not SI units)
- (one-thousandth of a metre)
- (one-millionth of a metre, or one-thousandth of a millimetre)
- Be careful with decimal point placement when converting between units
Common measurements include:
- Temperature
- pH
- Time
- Volume
- Length
- Mass
- Light intensity (measured in lux using a light meter)
- Optical density (measured using a colorimeter in arbitrary units, percentage transmission, or absorbance)
Selecting Appropriate Apparatus
If experiments demand greater accuracy, change the apparatus type. A syringe cannot accurately measure , so a syringe with finer graduations is needed. Similarly, a watch measures time in seconds, but a timer with greater precision is required for millisecond measurements.
Measuring microscopic structures: When measuring lengths under a microscope, such as chloroplast dimensions, a graticule is needed to measure in micrometres ().
When measuring time, you are limited by reaction time. Therefore, record time typically to the nearest or at most to . Round values from digital stopclocks accordingly.
Presenting data
Different data types require different presentation formats. Qualitative data, quantitative data, ecological study results, and microscope drawings each need appropriate presentation methods.
Table Formatting Standards
Enter experimental outcomes in properly formatted tables. Tables should have:
- Ruled lines separating cells
- Correct headings with appropriate units and symbols (in headings, not in cells)
- Independent variable in the first column
- Dependent variable observations in subsequent columns
Identify during planning and implementation stages how you will process and present collected data.
Recording data
Quantitative data must be recorded to the correct number of significant figures. When calculating a mean, the number of significant figures in the total determines how many significant figures should express the mean.
Worked Example: Calculating Means with Correct Significant Figures
The sum of and equals .
The mean to the same number of significant figures is therefore .
Decimal places: All data must be recorded to the same number of decimal places. Processed data may be recorded either to the same number of decimal places or to one more decimal place than raw data. This rule relates to measuring instrument resolution: if measuring apparatus records to the nearest whole number, precision cannot exceed one decimal place when calculating means.
Understanding Accuracy, Precision, and Resolution
These factors, combined with operator competence, determine data accuracy:
- Accuracy: How close a reading is to the true value
- Precision: How similar repeated measurements are to each other (how tightly clustered repeat readings are)
- Resolution: The smallest change in the quantity being measured that can be detected by the measuring instrument
Analysis
Once an experimental procedure is complete, collected results must be processed and interpreted to reach valid conclusions.
Data processing methods depend on experiment type:
Drawings (from life or microscope work) require no processing, though measurements and scale calculations may be needed.
Qualitative data cannot be processed mathematically due to lack of numerical values, but observation analysis is necessary. This analysis is generally subjective but can be made more objective by comparing against standards or conducting further quantitative experiments.
Quantitative experimental results require processing to enable valid conclusions.
Mathematical processing
At the simplest level, mathematical skills involve calculating rates or means. More advanced skills may include:
- Calculating standard deviation and standard error
- Applying statistical tests (chi-squared, Student's t-test, Spearman's rank correlation coefficient)
When using these tests, follow formulae steps in logical sequence, then understand the meaning of results and their impact on experimental conclusions.
Graphical presentation
Present outcomes using graphs, bar charts, or histograms as appropriate. Select the correct graphical format for your data type.
Graph Requirements
All graphs must have:
- Correct scaling with ascending equidistant intervals
- Correctly oriented axes
- Proper axis labels with correct units and symbols
- Clear data plots
Line graphs may be drawn using:
- Smooth line or curve of best fit: When confident in intermediate values, approximately of plots should fall on each side of the line
- Plot-to-plot line: Ruled lines connecting individual plots, used when no confidence exists in intermediate values
Graph size: Make good use of available paper. Plotted points should occupy at least half the graph grid in both and directions.
Using graphs: How graphs are used depends on experiment type. Enzyme experiments might require reading the gradient to determine rate, while other experiments might need reading the intercept to determine values such as water potential.
Evaluation of results
Evaluating results differs from evaluating procedures. This essential skill enables drawing valid conclusions from results, sometimes relying on mathematical processing and statistical tests.
During planning, you identified procedural limitations. Now evaluate these limitations regarding their impact on collected data. Experimental errors (operator errors or "one-off" errors) affect results and may produce anomalies. Identify anomalies by looking for results inconsistent with trends or other replicates—typically differences exceeding from the mean value.
Understanding Percentage Error
Precision and accuracy of apparatus and measurements significantly impact conclusion certainty. Apparatus margins of error, usually marked on glassware, can be used for percentage error calculations. This indicates error magnitude and its potential impact on results:
- Percentage error below may be considered statistically insignificant, validating conclusions
- Percentage error of is too large to ignore, undermining conclusion validity
Large percentage errors may lead to rejected conclusions or require retesting with improved apparatus or procedures to reduce error.
Practising practical techniques
Using laboratory glassware
Laboratory glassware serves numerous experimental techniques, so practice with various types is important. Using measuring cylinders accurately for volume measurement represents a basic practical skill. Select appropriate measuring cylinder size based on required volume—smaller cylinders often provide better resolution but may not hold sufficient volume.
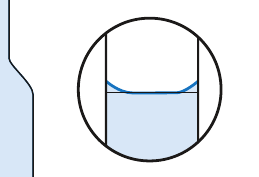
Reading the Meniscus
To measure volumes accurately, understand how to read volume correctly considering the meniscus. Read volumes at eye level, aligning the bottom of the meniscus with the graduation line on the measuring cylinder. When filling pipettes, the liquid meniscus should sit precisely on the volume mark on the pipette neck—this requires practice.
Using a microscope
Light microscope use represents an important biological skill because many organisms and structures are extremely small and only visible when magnified. This applies to tissues, cells, and cell organelles.
A light microscope operates by directing light through a thin biological specimen on a glass slide. Light passes through multiple lenses, allowing image observation through the eyepiece lens. Several objective lenses on a rotating disc can be selected, enabling viewing under both low and high power.
Microscope technique: Always start viewing specimens by focusing on low power and carefully positioning the specimen centrally in the field of view. This prevents losing the specimen when switching to higher magnification. Once focused on low power, rotating to higher power should maintain the specimen in view and roughly focused, though fine focusing improves clarity under high power.
Microscope drawings
Drawing specimens observed under microscopy provides a vital method to document and record observations. Biological drawings should be scientific rather than artistic, representing accurate records of what you observe.
Guidelines for Biological Drawings
- Draw structures exactly as seen, enabling others to identify the same structures from the same slide
- Clearly represent exact shape, proportion, and scale of features
- Draw lines in pencil using a sharp point for clear, continuous lines
- Do not use shading or colour
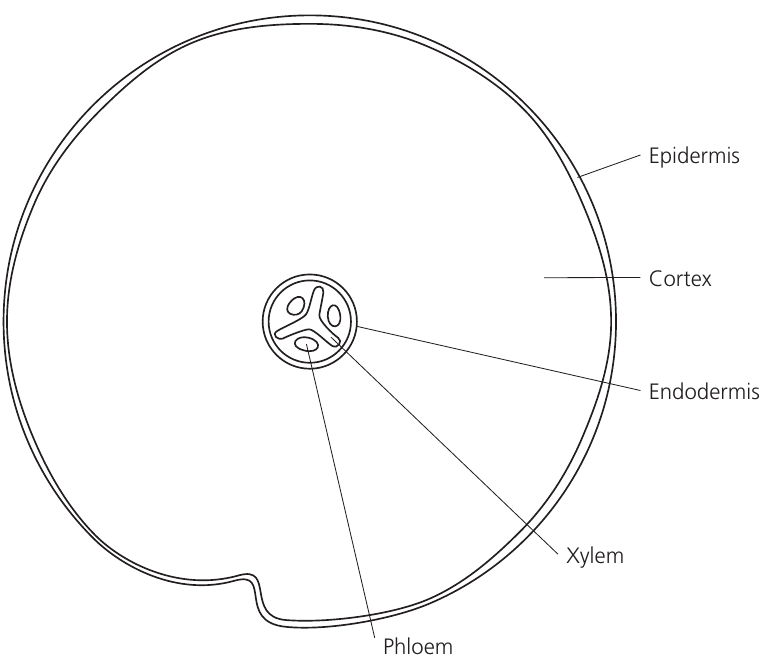
- Low-power drawings should be tissue plans with no cell detail
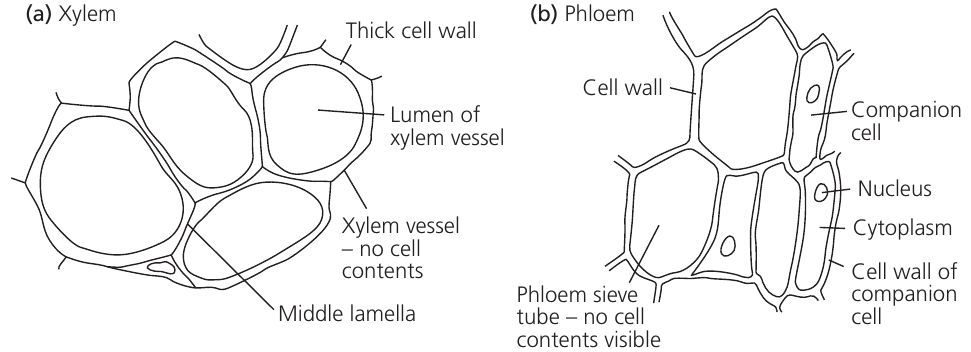
- High-power drawings should show detailed cellular structure, typically drawing no more than connected cells representative of all visible cell types
- Include magnification or scale indication (such as a scale bar)
- Draw label lines straight using a ruler, writing labels at line ends (not along lines)
- Use annotations to provide additional information about features (functions, properties, or observations)
- Make good use of available paper
Labelling: High-power drawings must be labelled with cell names (not tissue names). Low-power plans should be labelled only with tissue names (not cell names). For example, in a plant stem, the low-power plan should label "xylem" (the tissue name), while high-power drawings should label "xylem vessels" (the cell name).
Other biological drawings
Some microscope drawing guidelines also apply to other biological drawings:
- Lines must be in pencil, clear, sharp, and continuous
- No shading or colouring
- Include a scale
- Represent structures exactly with correct shape, proportion, and scale
- Label lines should be straight and drawn with a ruler
- Make good use of paper
Qualitative tests
Qualitative tests using reagents identify biological molecules through simple chemical tests producing colour changes. Examples include the starch test using iodine solution and the reducing sugar test using Benedict's solution.
Other qualitative tests use indicators changing colour when specific reactions occur. For instance, in the Hill reaction, the electron acceptor changes from coloured to clear when accepting electrons from chloroplast electron transport chains. Enzyme reactions may change cloudy milk solution to clear when casein protein is hydrolysed.
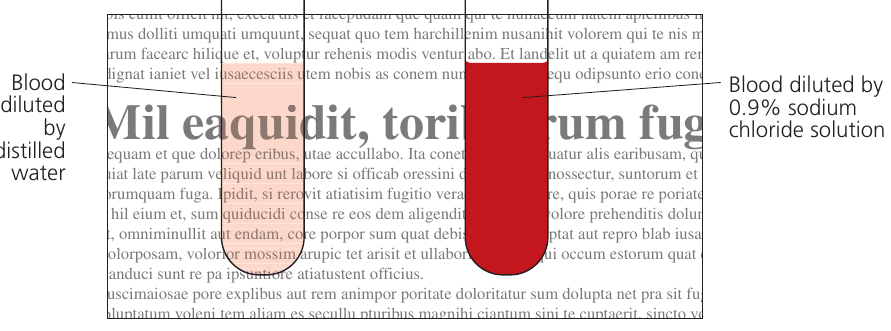
Worked Example: Red Blood Cell Experiments
When blood drops are added to water or dilute sodium chloride solutions, red blood cells burst, releasing haemoglobin into solution (making it transparent). In more concentrated solutions, red blood cells remain intact (keeping the solution opaque).
Recording effects of different sodium chloride concentrations on red blood cells can be done by testing whether solutions are transparent or opaque using newsprint.
Quantitative tests
Quantitative tests involve numerical data values and comprise many biological experiments.
Some experiments may be semi-quantitative, using colour standards to generate ranked data (such as the semi-quantitative Benedict's test).
To generate numerical data, quantitative tests must use apparatus measuring or collecting this data type. The simplest tests time colour changes or appearance changes, making time the numerical data. However, timing has uncertainty about exact endpoints, which is subjective—determining precise endpoints is difficult even using comparators as reference points.
Plotting graphs from standard sets provides another opportunity to gather numerical data, though this may also rely on endpoint judgement.
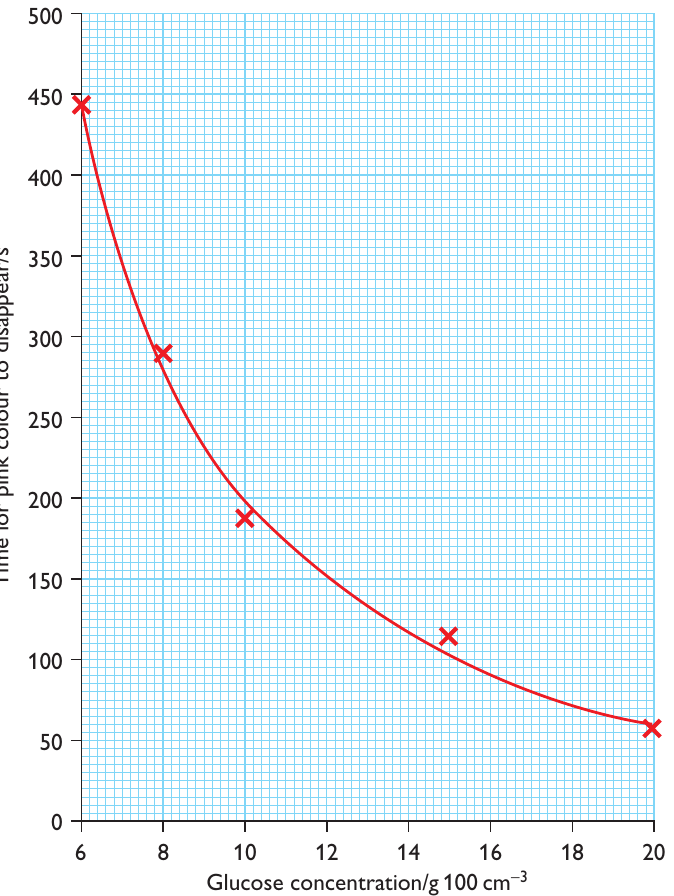
Worked Example: Glucose Concentration Timing Experiment
| Glucose concentration/g | Time for pink colour to disappear/s |
|---|---|
This data shows an inverse relationship between glucose concentration and reaction time, which can be plotted to create a standard curve for determining unknown concentrations.
Using a colorimeter: A colorimeter represents another suitable method for collecting numerical data. It measures light passing through coloured solutions to determine colour amount present. Various samples can be tested, such as betalain pigment solutions from beetroot cylinders left in water at different temperatures. A colour filter in the light path ensures correct wavelength measurement for specific pigments. For betalain (purple pigment), the correct wavelength is green light.
Colorimeter Technique
Zero the colorimeter before inserting each test tube, typically using distilled water in a cuvette. However, distilled water is sometimes inappropriate—the cuvette should instead contain the baseline liquid for the reaction. For example, when determining starch loss from starch-enzyme mixtures using a colorimeter, the blank should contain iodine solution (the starch-detecting reagent) rather than distilled water.
You need to understand colorimeter use and be aware of limitations and possible errors, including methods to reduce their impact.
Separating techniques
Chromatography: This technique separates unknown mixtures using a solvent that dissolves molecules and a medium such as paper. The solvent moves through the medium, carrying molecules with it. Molecules spread out and separate because they move at different rates.
Worked Example: Chromatography Method
- Carefully and slowly spot the mixture one drop at a time onto a small area approximately from the paper bottom (the origin)
- Dry spots between applications using a hairdryer to create small, tight, intense spots
- Lower the chromatogram into a container with solvent just below the spotted origin level
- Pre-saturate the container atmosphere by adding solvent and covering some time before use, ensuring solvent doesn't travel too fast and improving separation
- Once solvent has moved through the medium, remove the chromatogram
- Use pencil to mark the origin line, solvent front, and spot leading edges before drying
Identifying molecules: Calculate the Rf value of each solute and compare against known values:
Because Rf values are ratios, they are always less than and have no units.
Electrophoresis: This separation technique uses the principle that molecules in solution separate by size due to movement rate variation. Molecules move through fluid-covered gel using electric current. The smallest molecules travel furthest, separating solutes along the current line.
Safe and ethical use of organisms
Safety and Ethics with Live Organisms
When using live animals, take care to avoid harm. Water-based organisms should only be observed briefly, then returned to their main container quickly. Observe microscopic pond life using cavity slides ensuring sufficient water to protect organisms from dehydration or heat damage from microscope lights.
When investigating human subjects (such as pulse rate experiments and exercise effects), carefully plan exercise type and execution to prevent injury. Using chemicals such as caffeine and alcohol is prohibited—these toxins should not be administered in school situations.
Using aseptic techniques to investigate microorganisms
Sterile techniques prevent contamination of microbe cultures by other microbes, particularly important for preventing accidental human pathogen culture.
Aseptic Technique Procedures
- Carefully sterilise the experimental area; biologists must have clean hands and laboratory clothes
- Fully sterilise all apparatus, glassware, and collecting loops before use
- Sterilise culture medium (culture broth or agar plates) and pour under sterile conditions
- When sampling and transferring microbes, flame collecting loops and cool in sterile water to avoid collecting atmospheric microbes
- After use, clean and sterilise all areas and non-disposable apparatus; seal and autoclave disposable apparatus before disposal
Dissection
Dissection involves opening organisms (plants or animals) to observe internal structures. Use sharp scissors and scalpels safely but confidently to avoid damaging internal tissues when laying them open for clear viewing. Draw these structures as a dissection record.
Dissection Safety
Always use sharp instruments for clean dissection lines with minimal damage. To avoid self-injury, always cut away from yourself.
Using sampling techniques
Field investigations on populations require measuring population samples, as measuring entire populations is impossible. Samples must be representative of whole populations; therefore, samples must be random, avoiding bias such as selecting individuals for specific characteristics or ease of sampling.
Random sampling steps:
- Use a quadrat (square of known dimensions) to select and collect samples
- Select correct quadrat size and number using specific quadrat selection techniques
- Use random numbers to generate coordinates for quadrat placement in the chosen area
- Lay down a grid or double metre tapes to create a grid across the sampling area
When sampling seashores, factor in requirements such as sampling from different beach zones.
Sampling plant leaves or insects to measure size variation may require accounting for factors like age. Size variation determined by organism age rather than environmental conditions under study would invalidate the study, so only specimens of certain ages may be selected. For example, studying dog whelk shell height-to-width ratios might select only adults, ignoring juveniles.
Microscopic Sampling
Sometimes sampling techniques apply at microscopic levels, such as studying stomata density on leaf surfaces. An engraved slide with a grid counts stomata within squares determined using random numbers for coordinates. A specialised slide called a haemocytometer, engraved with detailed grids, was originally used in clinical laboratories for blood cell counts. Modern blood counts use lasers and computers.
Using technology such as data loggers or computer modelling
Many experiments suit data collection using data loggers. Uses range from simple data collection (pulse rate, potometer water loss) to complex data collection using various probes linked to computers. Computers then tabulate data, process means, perform statistical tests, and plot graphs.
Entering variation data into spreadsheets enables automatic calculation of means, standard deviations, and some statistical tests, allowing quick, efficient outcome comparison.
Computer-based modelling exercises supplement learning in laboratories or at home. These include ecological sampling studies, succession and zonation studies enabling comparison of ecological situations, and studies on disease impacts, predation, or predator-prey relationships examining theoretical population effects.
Key Points to Remember
- Plan thoroughly: Conduct preliminary research and studies to identify appropriate techniques, apparatus, and variables before beginning experiments
- Control variables carefully: Only change the independent variable; keep all controlled variables constant; include proper controls to validate that observed changes result from the independent variable
- Record data precisely: Use correct SI units, record to appropriate significant figures and decimal places, and understand the difference between accuracy, precision, and resolution
- Draw scientifically: Use pencil with clear continuous lines; no shading or colour; include appropriate labels, annotations, and scales; distinguish between low-power tissue plans and high-power cellular drawings
- Practice techniques: Develop competence in microscopy, qualitative and quantitative testing, chromatography (Rf calculations), sampling methods, aseptic techniques, and safe organism handling to build the practical skills essential for assessment