The Boltzmann Distribution (OCR A-Level Chemistry A): Revision Notes
The Boltzmann distribution
Introduction to molecular energy distribution
In gases, liquids, and solutions, molecules are constantly moving and colliding with one another and with container walls. These collisions are elastic, meaning the molecules maintain their kinetic energy - they don't slow down as a result of collisions and no energy is lost from the system.
However, molecules don't all move at the same speed. Some molecules travel slowly with relatively low kinetic energy, whilst others move rapidly with high kinetic energy. Most molecules have energies close to the average value. This spread of molecular energies follows a specific pattern called the Boltzmann distribution.
The Boltzmann distribution curve
The Boltzmann distribution can be represented graphically, with the number of molecules plotted against their kinetic energy. This creates a characteristic curve that helps us understand which molecules have sufficient energy to undergo chemical reactions.
On the graph, a vertical line marked represents the activation energy - the minimum energy that molecules must possess for a reaction to occur. The shaded region beyond this line shows the proportion of molecules with enough energy to react. In most cases, only a small fraction of molecules have energies exceeding .
Key features of the Boltzmann distribution
The Boltzmann distribution curve has several important characteristics that you need to understand:
Three Critical Features of the Distribution Curve:
No molecules with zero energy: The curve begins at the origin of the graph. This means there are no molecules with zero kinetic energy, as all molecules in a gas, liquid, or solution are moving to some extent.
Area represents total molecules: The total area underneath the curve corresponds to the total number of molecules in the sample. This area remains constant for a given sample, regardless of temperature changes.
No maximum energy limit: The curve never touches the x-axis, even at very high energies. Theoretically, there is no upper limit to the energy a molecule can possess - the curve approaches but never reaches the x-axis at high energy values. This means molecules could have infinitely high energy, though the probability becomes vanishingly small at extreme energies.
Temperature effects on the Boltzmann distribution
Temperature has a profound effect on the shape and position of the Boltzmann distribution curve. Understanding this relationship is crucial for explaining how temperature influences reaction rates.
When temperature increases, the average kinetic energy of molecules also increases. This causes several changes to the distribution curve:
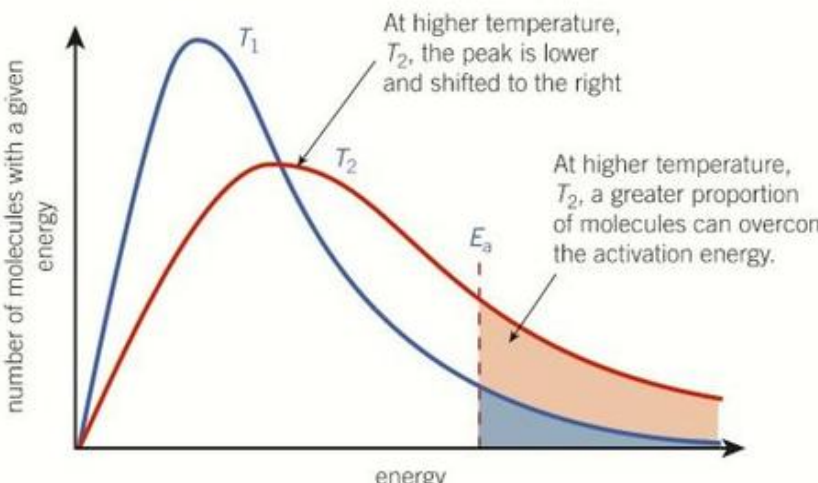
The peak shifts right: At higher temperature, the maximum point of the curve moves to a higher energy value along the x-axis. This reflects the increase in average molecular energy.
The peak becomes lower: As the curve spreads across a wider energy range, the peak height decreases. This is necessary because the total area under the curve (representing the total number of molecules) must remain constant.
Greater energy spread: The curve becomes broader and more stretched out, showing that molecules now possess a wider range of kinetic energies. Whilst some molecules still have low energy, many more now have higher energy values.
Although the curve changes shape at different temperatures, the total area under the curve always remains the same because the total number of molecules in the sample doesn't change. The molecules are simply redistributed across a wider energy range at higher temperatures.
Impact on reaction rates
The most important consequence of temperature increase is that a greater proportion of molecules now possess energy equal to or exceeding the activation energy (). This is shown by the larger shaded area beyond the line at higher temperature.
When more molecules have sufficient energy to overcome the activation energy barrier, more successful collisions can occur, leading to an increased rate of reaction. This explains why reactions typically proceed faster at higher temperatures.
It's worth noting that collision frequency also increases at higher temperature because molecules move faster. However, the increase in molecular energy is far more significant than the increase in collision frequency when explaining the temperature effect on reaction rate.
Catalysts and the Boltzmann distribution
A catalyst is a substance that increases the rate of a chemical reaction without being consumed in the process. Catalysts work by providing an alternative reaction pathway with a lower activation energy.
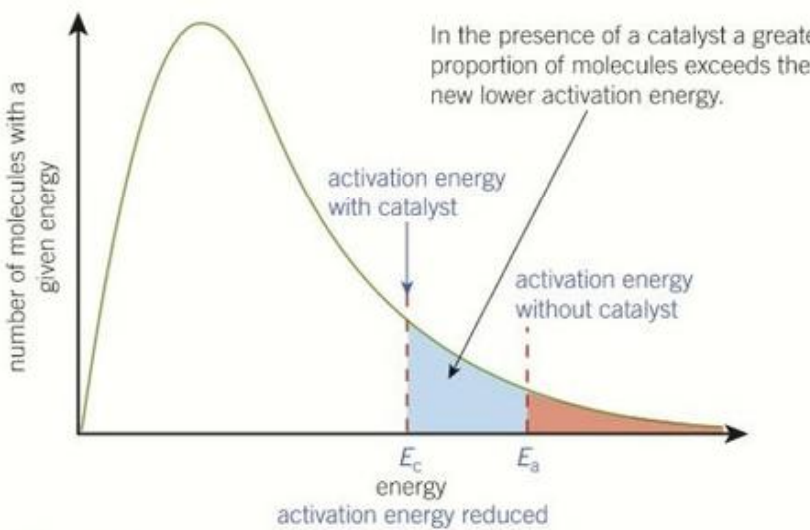
The effect of a catalyst can be understood using the Boltzmann distribution curve. When a catalyst is present, the activation energy is reduced from (without catalyst) to (with catalyst), where .
Key Concept: The catalyst does not change the distribution curve itself - the shape and position of the curve remain the same because the catalyst doesn't alter the kinetic energies of the molecules. Instead, by lowering the activation energy threshold, the catalyst effectively moves the energy requirement to the left on the x-axis.
How catalysts increase reaction rates
With a lower activation energy barrier, a much greater proportion of molecules now possess sufficient energy to react. This is represented by the larger shaded area beyond compared to the area beyond .
When more molecules have enough energy to overcome the (now lower) activation energy barrier, more collisions result in successful reactions. This leads to an increased rate of reaction, even though the actual energy distribution of molecules remains unchanged.
This is why catalysts are so valuable in chemical processes - they allow reactions to proceed more rapidly without the need to increase temperature, which can save energy and prevent unwanted side reactions.
Comparing Temperature vs Catalyst Effects:
Temperature increase:
- Changes the shape and position of the distribution curve
- Shifts the peak right and down
- Increases the proportion of molecules with
- Result: Faster reaction rate
Catalyst addition:
- Does NOT change the distribution curve
- Lowers the activation energy from to
- Increases the proportion of molecules with
- Result: Faster reaction rate (without increasing temperature)
Remember!
Key Points to Remember:
- The Boltzmann distribution shows how molecular kinetic energies are spread out in a gas, liquid, or solution
- The curve always starts at the origin (no zero-energy molecules) and never meets the x-axis at high energies (no maximum energy limit)
- The area under the curve equals the total number of molecules and remains constant
- Increasing temperature shifts the peak right and down, spreading the distribution over a wider energy range whilst keeping the same total area
- At higher temperature, more molecules exceed the activation energy (), resulting in faster reaction rates
- Catalysts lower the activation energy from to without changing the energy distribution curve
- With a catalyst, a greater proportion of molecules can overcome the lower energy barrier, increasing the reaction rate