Aggregate demand (OCR A-Level Economics): Revision Notes
📚 Revision Notes
1.2 Aggregate demand
DEFINITIONS:
- Aggregate demand: the total demand for goods and services produced in an economy at a given price level and in any given time period
- Marginal Propensity to Consume (MPC): the proportion of additional income allocated to consumption
- Marginal Propensity to Save (MPS): the proportion of additional income allocated to saving
Explain
1.2.1 Aggregate Demand and its components
AD is depicted as a downward-sloping curve on a graph where the horizontal axis represents the real output (GDP) and the vertical axis represents the price level. AD is composed of four main components: Consumption (C), Investment (I), Government Spending (G), and Net Exports (X-M).
Components of Aggregate Demand:
- Consumption (C):
- Definition: Expenditure by households on goods and services.
- Factors Influencing Consumption:
- Disposable income
- Interest rates
- Consumer confidence
- Wealth effects
- Investment (I):
- Definition: Expenditure by firms on capital goods such as machinery, equipment, and buildings.
- Factors Influencing Investment:
- Interest rates
- Business confidence
- Availability of finance
- Technological advancements
- Government Spending (G):
- Definition: Expenditure by the government on goods and services.
- Factors Influencing Government Spending:
- Fiscal policy
- Economic priorities
- Social welfare programmes
- Net Exports (X-M):
- Definition: The value of exports (X) minus the value of imports (M).
- Factors Influencing Net Exports:
- Exchange rates
- Economic conditions abroad
- Trade policies
Explain, with the aid of a diagram
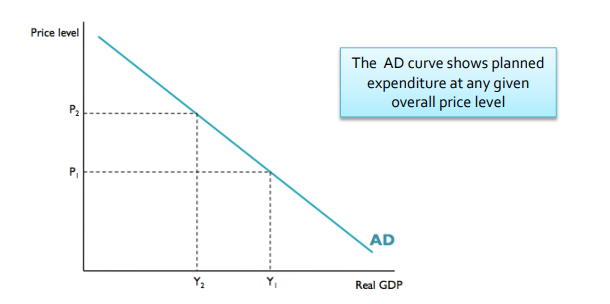
1.2.2 The relationship between aggregate demand and price level
The AD curve slopes downwards from left to right, indicating an inverse relationship between the price level and the quantity of output demanded.
- Graph:
- The vertical axis represents the price level.
- The horizontal axis represents real GDP/output.
- The AD curve shows that as the price level falls, the quantity of goods and services demanded increases. There are 3 effects which explain why the AD curve is downward sloping:
| EFFECT | EXPLANATION |
|---|---|
| The Wealth Effect | A lower price level increases the real value of households' wealth, leading to higher consumption. |
| The Interest Rate Effect | A lower price level reduces the demand for money, leading to lower interest rates, which in turn stimulates investment and consumption. |
| The International Trade Effect | A lower domestic price level makes domestic goods cheaper relative to foreign goods, increasing exports and decreasing imports, thus raising net exports. |

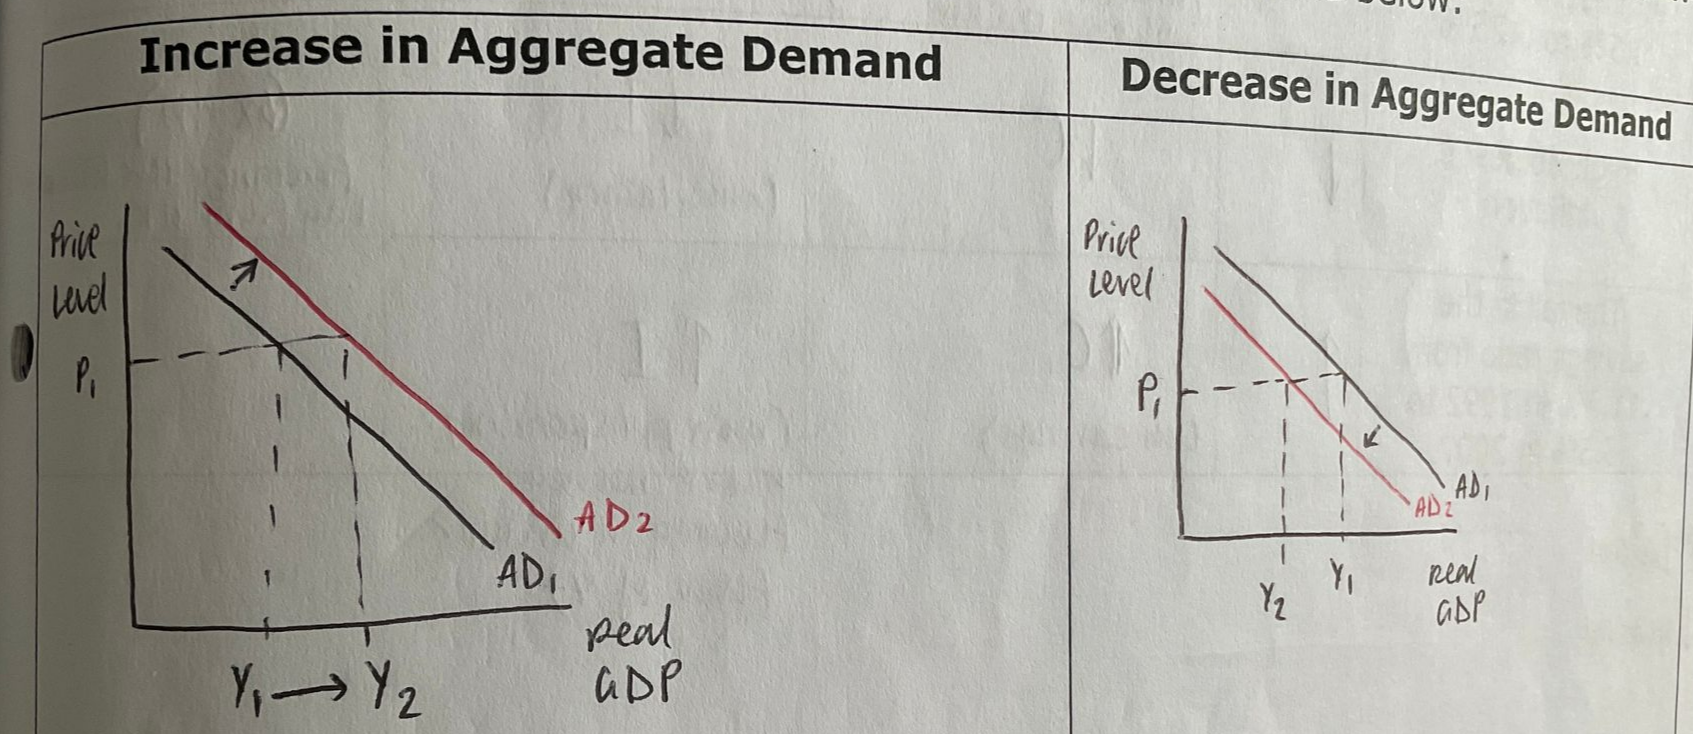
1.2.3 Shifts in the aggregate demand curve
Shifts in the AD curve occur due to changes in any of the components of AD (C, I, G, X-M).
- Rightward Shift: Indicates an increase in AD (e.g., due to a rise in consumer confidence, increased government spending, or higher investment).
- Leftward Shift: Indicates a decrease in AD (e.g., due to higher interest rates, reduced government spending, or a decline in net exports).