Graphs of functions (AQA GCSE Further Maths): Revision Notes
Graphs of functions
Understanding different approaches to graphing
When working with graphs of functions, you'll encounter two main approaches depending on what the question asks for. Each method has its own purpose and specific requirements that you need to follow carefully.
Understanding the difference between these two approaches is crucial for GCSE success, as using the wrong method can cost you marks even if your mathematical understanding is correct.
Drawing or plotting a graph
When you're asked to draw or plot a graph, this means you need to create a precise, accurate representation. This approach requires several important steps that ensure mathematical accuracy.
First, you must use graph paper for this type of question. The grid lines help you plot points exactly where they should be positioned. Without graph paper, you won't be able to achieve the precision that's required.
Next, make sure to number your axes clearly. Both the x-axis and y-axis need numerical scales that are easy to read and appropriate for the range of values you're working with.
The most crucial part is plotting the points accurately. You'll either be given specific coordinate points to plot, or you'll need to calculate them using the function's equation. Each point must be positioned exactly on the correct grid intersection.
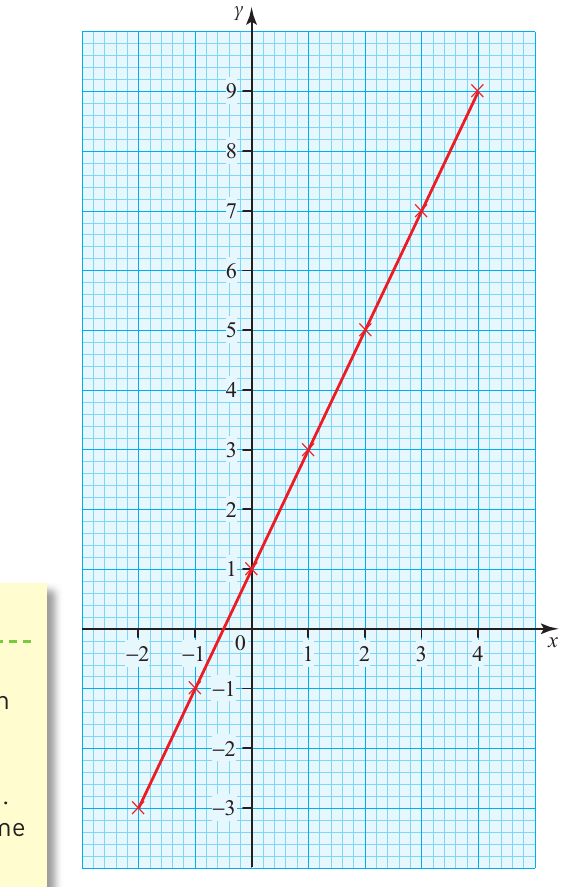
Worked Example: Drawing y = 2x + 1
For drawing the graph of for values of from to :
Step 1: Calculate coordinate points
- When : →
- When : →
- When : →
- When : →
Step 2: Plot each point precisely on graph paper Step 3: Draw a straight line through all points
Sometimes you might see the notation and then be asked to draw the graph of . Don't worry - this is exactly the same instruction as drawing . The function notation is just another way of expressing the same relationship.
Sketching a graph
Sketching a graph is quite different from drawing one, and understanding this distinction is essential for exam success. When you're asked to sketch a graph, you should not use graph paper at all.
Critical Point: Never use graph paper when sketching! This is a common mistake that can lose you marks. The examiner wants to see that you understand the difference between precise plotting and showing mathematical understanding through shape.
Instead, you need to draw your own axes and focus on showing the correct shape of the graph in the right position. The emphasis here is on demonstrating that you understand the key features and overall behaviour of the function, rather than plotting precise points.
You should still mark certain important numbers on your axes, particularly points where the graph crosses the axes or other significant coordinates. However, you don't need to plot every single point with mathematical precision.
The main goal when sketching is to show that the graph has the correct shape and is positioned properly relative to the axes. This means capturing the essential characteristics of the function while keeping the drawing simple and clear.
Domain considerations and axis setup
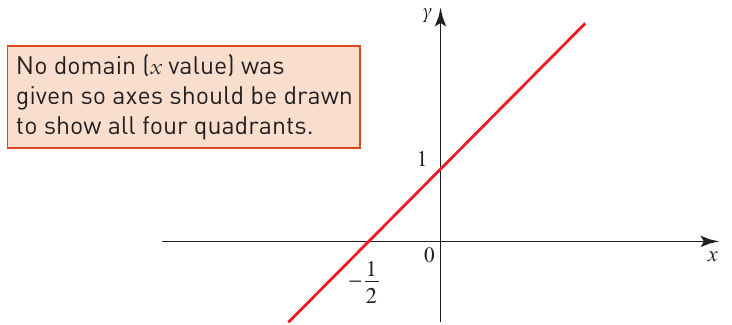
An important point to remember involves the domain of your function. The domain refers to the range of x-values that you're working with.
Domain Rule: When no specific domain is given in the question, you should draw your axes to show all four quadrants of the coordinate plane. This demonstrates that you understand the function continues beyond any particular range and helps show the complete behaviour of the function.
However, if the question specifies a particular range of x-values (like "for from to "), then you can focus your axes on that specific range.
This rule applies to both drawing and sketching - when in doubt about the domain, show all four quadrants to be safe.
Key differences summary
The main differences between these two approaches can help you remember which method to use:
Drawing/Plotting:
- Use graph paper
- Number axes precisely
- Plot calculated or given points exactly
- Draw accurate lines through points
Sketching:
- No graph paper needed
- Draw your own axes
- Focus on correct shape and position
- Mark key features only
- Emphasise understanding over precision
Both methods require you to understand the function's behaviour, but they test different skills - drawing tests your ability to work precisely with coordinates, while sketching tests your understanding of the function's overall characteristics.
Key Points to Remember:
- Drawing requires graph paper and precise point plotting, while sketching focuses on shape and key features without graph paper
- Always number your axes clearly, regardless of which method you're using
- When no domain is specified, show all four quadrants to demonstrate complete understanding
- The notation and "draw " means the same as drawing
- Mark important points like axis crossings even when sketching, but don't worry about plotting every coordinate precisely