Gradients of lines (AQA GCSE Maths): Revision Notes
Gradients of lines
What is gradient?
Gradient measures how steep a straight line is on a graph. It tells you how much one variable changes when the other variable changes. Think of gradient as the "slope" of a line - whether it goes up steeply, down steeply, or stays level.
The gradient shows the relationship between two quantities and is fundamental to understanding how variables interact with each other in mathematical contexts.
For example, if you're looking at how much money a film makes compared to its budget, the gradient tells you how the earnings change as the budget increases.
How to calculate gradient
To find the gradient of any straight line, you need to use this key formula:
Gradient = distance up ÷ distance across
This is sometimes called "rise over run" - how much the line rises vertically compared to how far it runs horizontally.
The triangle method
The most reliable way to calculate gradient is to draw a triangle on your line:
Worked Example: Using the Triangle Method
- Pick two clear points on the line that are far apart
- Draw a right-angled triangle using these points
- Measure the vertical distance (distance up)
- Measure the horizontal distance (distance across)
- Divide distance up by distance across
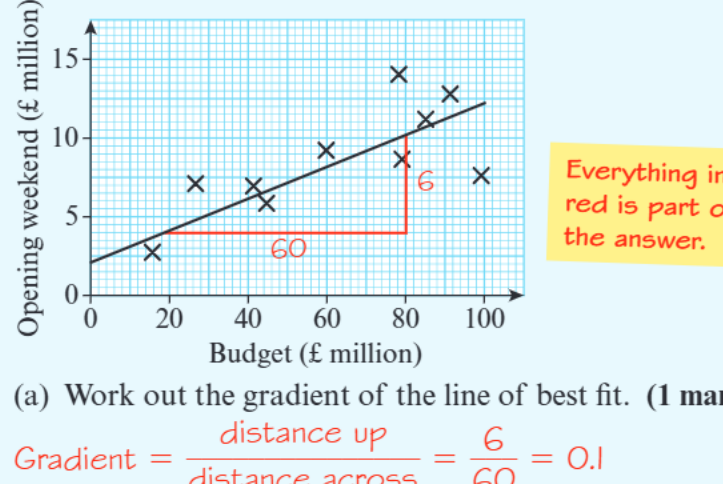
In this example, the triangle shows a distance across of 60 and distance up of 6, giving a gradient of .
Types of gradient
Lines can have three different types of gradient, each telling you something different about the relationship between your variables.
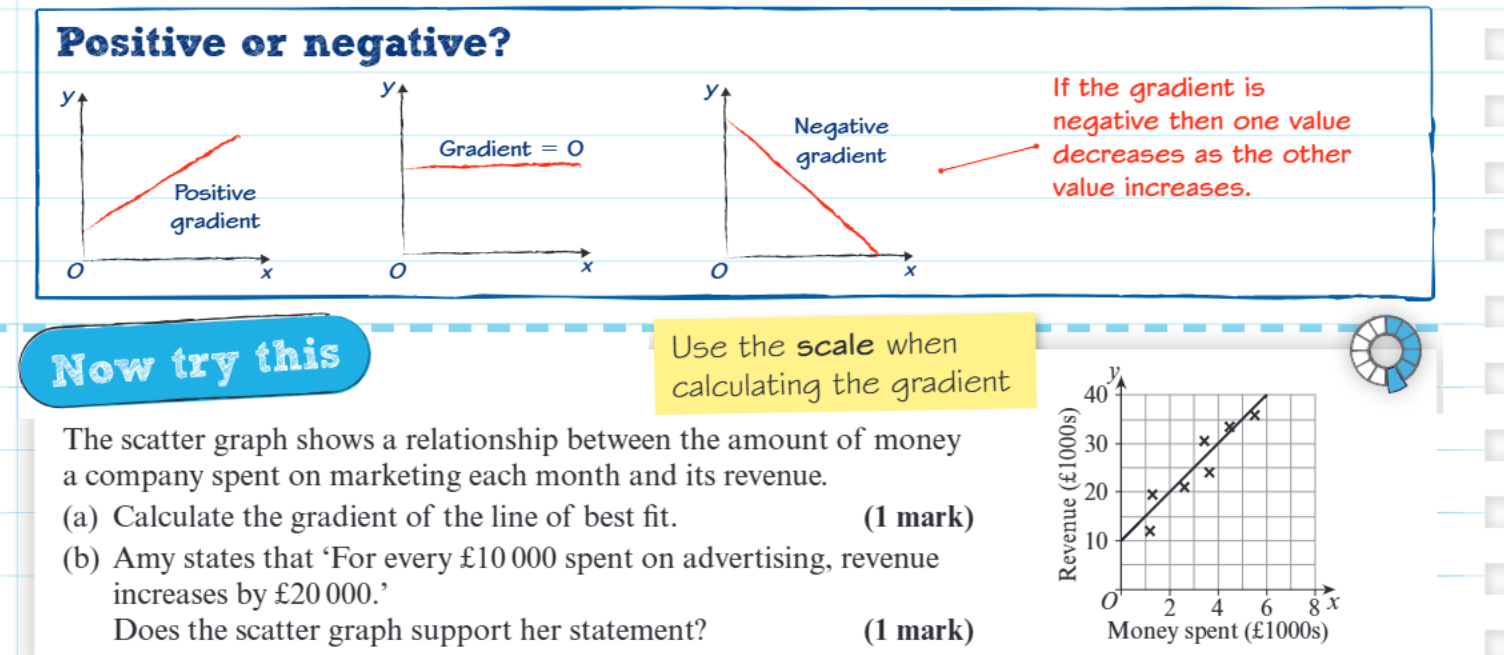
Positive gradient
- Line slopes upward from left to right
- As one value increases, the other also increases
- Example: More money spent on a film budget usually means higher earnings
Zero gradient
- Line is horizontal (perfectly flat)
- One value stays the same no matter what happens to the other
- The gradient equals 0
Negative gradient
- Line slopes downward from left to right
- As one value increases, the other decreases
- Example: As temperature increases, heating costs might decrease
Essential tips for accurate calculations
When calculating gradients, these tips will help you get the right answer:
Critical Tips to Avoid Common Mistakes:
Use large triangles - Draw your triangle as large as possible on the line. Larger triangles give more accurate results because small measurement errors have less impact.
Check the scale carefully - Always look at the numbers on both axes. Don't just count grid squares - use the actual values shown on the scales.
Draw on grid lines - Try to place one side of your triangle exactly on a major grid line. This makes measuring distances much easier and more accurate.
Show your working - Always write down the distance up and distance across clearly, then show your division calculation.
Interpreting gradients in real situations
Understanding what gradient means in context is crucial for exam success. The gradient tells you the rate of change between two variables.
When interpreting gradients in real-world contexts, always consider the units and what they represent in practical terms.
For example:
- If a line showing advertising spend vs revenue has a gradient of 2, this means revenue increases by £2 for every £1 spent on advertising
- If a line showing time vs temperature has a gradient of -0.5, this means temperature decreases by 0.5 degrees for every unit of time
When asked whether data supports a statement, compare the gradient you calculated with what the statement claims. If they match (approximately), then the data supports the statement.
Key Points to Remember:
- Gradient measures steepness - it shows how one variable changes compared to another
- Use the triangle method - draw a large right-angled triangle to calculate distance up ÷ distance across
- Positive gradients slope upward - both variables increase together
- Negative gradients slope downward - as one increases, the other decreases
- Always check your scale - don't just count squares, use the actual values on the axes