Quadratic graphs (AQA GCSE Maths): Revision Notes
Quadratic graphs
What are quadratic graphs?
A quadratic equation always includes a term where x is squared (x²). When you plot a quadratic equation on a coordinate grid, it creates a curved graph rather than a straight line. This curved shape is called a parabola.
The key thing to remember is that the x² term is what makes the equation quadratic and gives the graph its distinctive curved appearance.
Unlike linear equations which produce straight lines, quadratic equations always create curved graphs because of the x² term. This is the fundamental difference that makes quadratic graphs unique and recognisable.
Key features of quadratic graphs
The most important feature of a quadratic graph is the turning point. This is the point where the curve changes direction - it's either the highest point or the lowest point on the graph.
Quadratic graphs always have one of two shapes:
- U-shape - opens upward (when the x² coefficient is positive)
- Inverted U-shape - opens downward (when the x² coefficient is negative)
The turning point represents either the minimum value (for U-shaped curves) or the maximum value (for inverted U-shaped curves) of the equation.
The turning point is crucial for understanding quadratic graphs. It's where the curve reaches its highest or lowest value, and it's always the vertex of the parabola. Every quadratic graph has exactly one turning point.
How to plot quadratic graphs
The most reliable method for plotting quadratic graphs is using a table of values. This systematic approach ensures accuracy and helps you identify the turning point.
Here's the step-by-step process:
- Choose x-values - Select a range of x-values, including negative and positive numbers
- Calculate y-values - Substitute each x-value into the equation to find the corresponding y-value
- Complete your table - Fill in all the coordinate pairs (x, y)
- Plot the points - Mark each coordinate pair accurately on your grid
- Draw the curve - Connect the points with a smooth, curved line
The table of values method is particularly effective for quadratic graphs because it helps you see the pattern of the curve before you draw it. By calculating several points, you can identify where the turning point occurs and ensure your curve has the correct shape.
Drawing techniques for quadratic curves
To create accurate quadratic graphs, follow these essential techniques:
- Use a sharp pencil for precise plotting and clear lines
- Plot points carefully - double-check each coordinate before marking
- Draw a smooth curve that passes through every plotted point
- Label your graph with the equation
- Check your work - all points should lie perfectly on your curve
When drawing the curve, it's helpful to turn your graph paper so your hand stays inside the curve as you draw. This technique helps create smoother, more accurate lines.
A common mistake is drawing quadratic graphs as a series of straight lines connecting the points. Remember that quadratic graphs must be smooth, continuous curves. No part of a quadratic graph should contain straight line segments.
Worked example walkthrough
Worked Example: Plotting y = 4x - x²
Let's examine how to work with the equation .
When completing a table of values, you substitute each x-value into the equation. For example:
- When x = -1:
- When x = 0:
- When x = 2:
- When x = 4:
After plotting these points, you'll notice the curve forms an inverted U-shape with the turning point at (2, 4). This is the highest point on the graph.
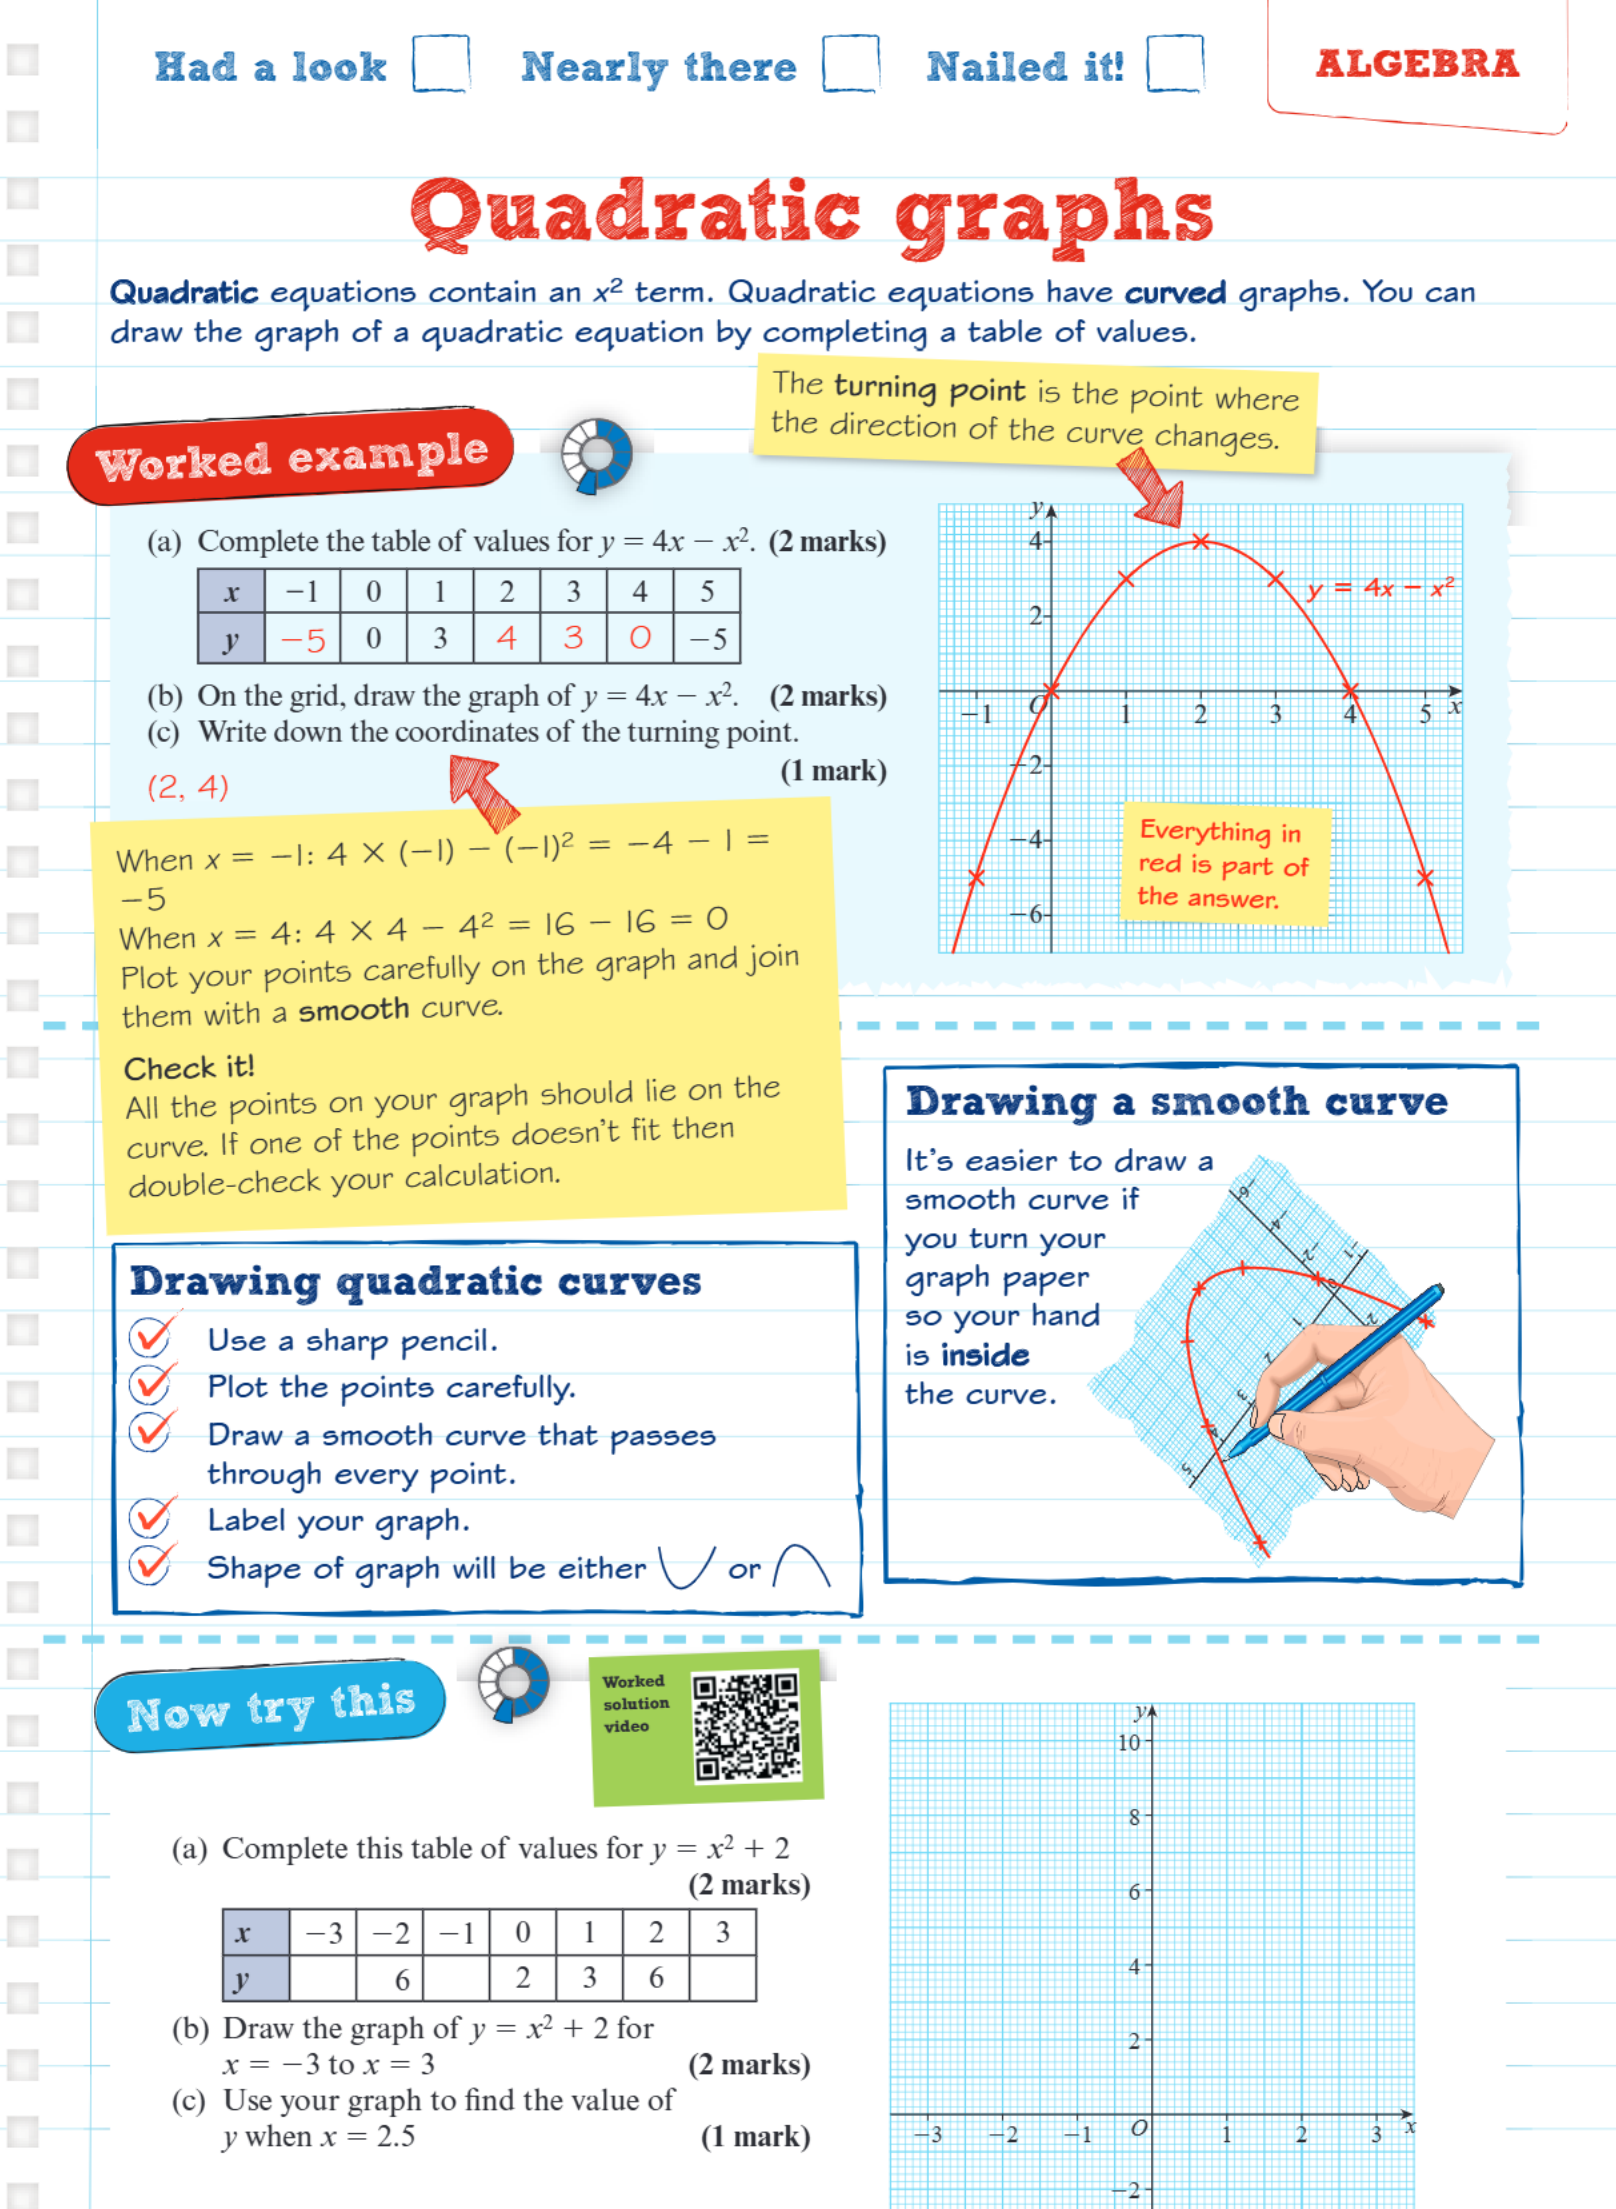
The graph clearly shows how the plotted points connect to form a smooth parabola, with the turning point clearly identified at coordinates (2, 4).
Remember!
Key Points to Remember:
- Quadratic equations always contain an x² term which creates curved graphs called parabolas
- The turning point is where the curve changes direction - it's either the maximum or minimum point
- Use a table of values to plot quadratic graphs systematically and accurately
- Draw smooth curves that pass through all plotted points using a sharp pencil
- Quadratic graphs are either U-shaped or inverted U-shaped depending on whether the x² coefficient is positive or negative