Real-life graphs (AQA GCSE Maths): Revision Notes
Real-life graphs
Real-life graphs help us understand and represent everyday situations, particularly those involving costs, pricing, and relationships between different quantities. These graphs show practical scenarios like mobile phone bills, taxi fares, or t-shirt printing costs.
Reading graph scales carefully
When working with real-life graphs, understanding the scale is fundamental to accurate interpretation and calculation.
Always check the scale before making any calculations or interpretations. Each small square on the grid represents a specific value, and this can vary between different graphs.
Key points about scales:
- Look at the numbers on both axes
- Work out what each grid square represents
- Don't assume each square equals 1 unit
- Small errors in scale reading lead to wrong answers
Understanding gradient in real-life contexts
The gradient of a straight-line graph has a specific meaning in real-life situations. It tells us the rate of change between two quantities.
Understanding Gradient in Context
Gradient = how much the vertical variable increases when the horizontal variable increases by one unit
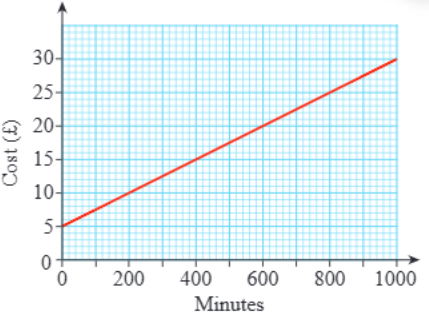
In cost graphs, gradient often represents the cost per unit (per mile, per minute, per item). Straight-line graphs have a constant gradient, meaning the rate stays the same throughout.
Types of pricing structures in graphs
Real-life graphs often show different pricing models that reflect how businesses structure their costs:
Fixed cost plus variable cost:
- Graph starts above zero (showing the fixed cost)
- Line slopes upward (showing additional cost per unit)
- Example: Taxi fare = fixed charge + cost per mile
Simple variable cost:
- Graph starts at zero
- Line slopes upward from the origin
- Example: Cost per t-shirt with no setup fee
Worked example analysis
Worked Example: Systematic Graph Analysis
When analysing real-life graphs, follow this systematic approach:
Step 1: Identify what the graph shows
- Read the axis labels carefully
- Understand what real-life situation is represented
Step 2: Read values from the graph
- Use the scale to find specific points
- Draw lines to help read values accurately
Step 3: Interpret the components
- Identify any fixed costs (y-intercept)
- Calculate the variable cost (gradient)
- Understand what each part means in the real situation
Common real-life graph contexts
Understanding the variety of real-life situations that can be represented graphically helps in interpreting and solving problems effectively.
Transportation costs:
- Taxi fares (fixed charge + cost per mile)
- Car hire (daily rate + mileage charge)
Communication costs:
- Mobile phone bills (monthly fee + cost per minute)
- Internet packages (fixed monthly cost + usage charges)
Business pricing:
- Printing services (setup cost + cost per item)
- Event planning (fixed costs + per-person charges)
Exam tips for real-life graphs
Success in exam questions requires careful attention to detail and systematic approach to graph interpretation.
Reading the graph:
- Always check what each axis represents
- Pay attention to the scale on both axes
- Look for where the line crosses the y-axis (often the fixed cost)
Calculating from graphs:
- Use a ruler to draw accurate lines
- Read coordinates carefully
- Show your working clearly
Interpreting meaning:
- Explain what the gradient represents in the context
- Identify fixed and variable costs
- Relate your answer back to the real-life situation
Key Points to Remember:
- Always check the scale before reading any values from the graph
- Gradient represents rate of change - in cost graphs, this is usually cost per unit
- Y-intercept often shows fixed costs that apply regardless of usage
- Straight lines indicate constant rates - the cost per unit stays the same
- Read questions carefully to understand what the graph represents in real life