Problem-solving practice 1 (AQA GCSE Maths): Revision Notes
Problem-solving practice 1
Understanding problem-solving in GCSE maths
Around half of your Foundation GCSE exam questions will require you to use problem-solving skills. These questions test your ability to reason, interpret information, and communicate mathematically. When you encounter tricky or unfamiliar questions, having a clear strategy helps you tackle them confidently.
Problem-solving questions are designed to test your mathematical thinking beyond just applying memorised procedures. They require you to analyse situations, make connections between different mathematical concepts, and explain your reasoning clearly.
Core problem-solving strategies
When facing challenging problems, use these five key approaches:
- Sketch a diagram - Visual representations help you understand what's happening in the problem
- Try simpler numbers - Replace complex values with easier ones to see the pattern
- Plan your strategy - Think through your approach before jumping into calculations
- Write down relevant formulae - Note any mathematical rules that might be useful
- Use variables - Represent unknown values with letters like x or n
These strategies work together to break down complex problems into manageable steps. You don't need to use all five for every problem, but having them in your toolkit gives you multiple ways to approach unfamiliar questions.
Practice problem 1: Choosing the right data representation
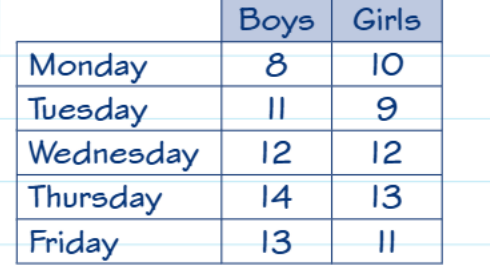
Keith collected data about Year 7 pupils absent from school last week. The information shows the number of boys and girls absent each day.
When asked to draw a suitable diagram to compare this data, you need to choose between different types of charts. The key is understanding what type of data you're working with and what comparison you want to make.
Worked Example: Selecting Appropriate Data Representation
Problem: Keith's absence data shows boys and girls absent each day of the week.
Step 1: Identify the data type
- We have two distinct categories: boys and girls
- We want to compare these categories across different days
Step 2: Choose the appropriate chart type
- Since we're comparing separate categories (not showing change over time), a bar chart is most suitable
Step 3: Justify the choice
- Bar charts clearly show differences between distinct groups
- Each day can have separate bars for boys and girls, making comparison easy
Bar charts vs line graphs
Bar charts work best when:
- You're comparing different categories (like boys vs girls)
- The data represents separate, distinct groups
- You want to show differences between groups clearly
Line graphs work best when:
- You're showing how something changes over time
- The data points connect to show a trend or pattern
- You want to display continuous data
For Keith's data, a bar chart would be most suitable because we're comparing two distinct categories (boys and girls) across different days.
Essential tip for data representation:
- Always label both axes correctly
- Include a clear key showing which bars (or lines) represent boys and which represent girls
- Make sure your chosen chart type matches the data you're displaying
Practice problem 2: Finding missing values using averages
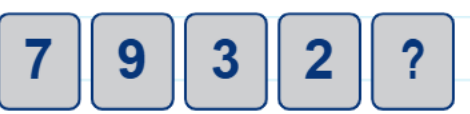
Abi has five cards with numbers written on them. Four cards show the numbers 7, 9, 3, and 2, while one card has a hidden number.
We know that the mean of all five numbers is 6. This information allows us to find the hidden number using the relationship between mean, sum, and count.
Worked Example: Finding Missing Values Using Averages
Given information:
- Four known numbers: 7, 9, 3, 2
- One unknown number
- Mean of all five numbers = 6
Step 1: Use the rearranged mean formula
Step 2: Calculate the total sum needed
Step 3: Find the sum of known numbers
Step 4: Calculate the missing number
Answer: The hidden number is 9
Working with averages
The mean is calculated using this formula:
We can rearrange this formula to find missing information:
In this problem:
- Mean = 6
- Number of values = 5
- Therefore: Sum of all values =
Now we can find the hidden number:
- Known numbers:
- Total sum needed: 30
- Hidden number =
Key formula to remember:
This rearranged formula is extremely useful for finding missing values in datasets when you know the average.
Exam guidance
Problem-solving questions often appear worth 2-4 marks, indicating they require multiple steps or clear reasoning. Always:
- Show your working clearly
- State what each calculation represents
- Check your answer makes sense in the context
- Use appropriate mathematical vocabulary in explanations
Key Points to Remember:
- Plan before you calculate - spending time understanding the problem saves time overall
- Draw diagrams when possible - visual aids help clarify complex situations
- Choose appropriate data representations - bar charts for comparing categories, line graphs for showing change over time
- Use the rearranged mean formula - is essential for finding missing data
- Show all working - problem-solving marks are often awarded for method as well as the final answer