Grouped Frequency Tables (AQA GCSE Maths): Revision Notes
Grouped frequency tables
What are grouped frequency tables?
Grouped frequency tables are a way of organising data by sorting it into different ranges or classes. They're similar to regular frequency tables, but instead of listing individual values, they group the data into intervals. This makes it easier to handle large amounts of data and spot patterns.
When dealing with large datasets, individual frequency tables become unwieldy. Grouped frequency tables solve this by creating manageable chunks of data that still preserve the overall distribution and patterns.
Understanding class intervals
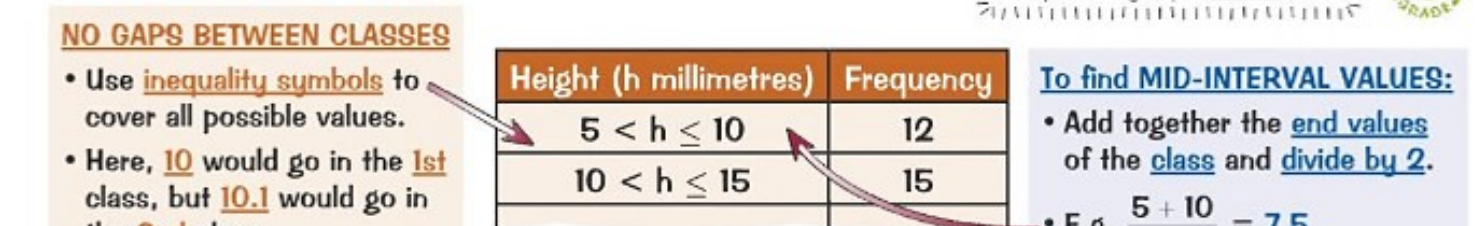
When creating grouped frequency tables, we need to make sure there are no gaps between the different classes. We use inequality symbols (< and ≤) to define the boundaries clearly.
Critical Rule: No Gaps Between Classes
The inequality symbols must be used correctly to ensure every possible value has exactly one place to go. This prevents data from being lost or misclassified.
For example, if we have height measurements, we might use:
- First class:
- Second class:
Notice how the value 10 would go in the first class, whilst 10.1 would go in the second class.
Finding mid-interval values
Since we don't know the exact values within each class, we use the mid-interval value to represent the whole class. This gives us a single number that sits in the middle of each class range.
Worked Example: Calculating Mid-Interval Values
To calculate the mid-interval value:
Step 1: Add the two end values of the class together Step 2: Divide the result by 2
For the class : Mid-interval value =
Formula: Mid-interval value =
Calculating averages from grouped frequency tables
Unlike regular frequency tables where you know the exact data values, grouped frequency tables only show you the classes the data falls into. This means you have to estimate the mean rather than calculate it exactly.
Why We Estimate
In grouped data, we lose information about individual values. For example, if we know 5 people have heights in the range 160-170cm, we don't know if they're all 165cm or if some are 162cm and others are 168cm. This is why our calculations become estimates.
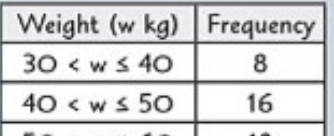
Finding the modal class
The modal class is simply the class interval that has the highest frequency. Look through your frequency column and identify which class has the most data points - that's your modal class.
Locating the median
To find the class containing the median:
- Calculate the median position using: , where is the total number of data points
- Count through the frequency column from the top until you reach this position
- The class where this position falls is the class containing the median
Estimating the mean
To estimate the mean from a grouped frequency table:
- Add a third column for mid-interval values
- Add a fourth column showing 'frequency × mid-interval value' for each class
- Add up all the values in the fourth column to get the total
- Divide this total by the total frequency (total number of data points)
The formula becomes: Mean =
Estimating the range
The range can only be estimated using the class boundaries. Find the difference between the highest possible value and the lowest possible value across all classes.
Worked example
Worked Example: Complete Analysis of Weight Data
Using weight data for 60 school children, let's find all the averages:
Modal class: Look for the highest frequency. In this case, it's 18, so the modal class is .
Median: The median position is . This means we need the 30.5th value, which falls in the class .
Mean: Using the mid-interval values and frequencies, the calculation gives an estimated mean of 53.7 kg.
Range: The estimated range is kg, using the class boundaries.
Key Points to Remember:
- Grouped frequency tables organise data into class intervals using inequality symbols
- Mid-interval values represent each class and are calculated by adding the class boundaries and dividing by 2
- The modal class is the one with the highest frequency
- The median class is found by calculating the median position and counting through the frequencies
- The mean is estimated using mid-interval values multiplied by frequencies, then divided by the total frequency
- All calculations from grouped data are estimates, not exact values