Probability Experiments (AQA GCSE Maths): Revision Notes
Probability experiments
What are probability experiments?
A probability experiment is any activity where you collect data about different outcomes that could happen. This could be something as simple as rolling a dice or spinning a spinner. The key is that you're testing what actually happens when you repeat the same action many times.
Fair vs biassed experiments
When working with probability experiments, it's important to understand whether your equipment is fair or biassed.
Fair equipment
With fair equipment, like a normal dice, each outcome has an equal chance of happening. For example, when you roll a fair six-sided dice, each number (1, 2, 3, 4, 5, 6) has exactly the same probability of being rolled - which is . This means that if you roll the dice many times, you'd expect to get roughly the same number of each result.
Biassed equipment
However, if your dice or spinner is biassed (sometimes called "wonky"), then each outcome won't have an equal chance of happening. Some numbers might come up more often than others.
When equipment is biassed, you can't simply work out probabilities by looking at it - you need to actually test it by doing experiments.
Using relative frequency to estimate probability
When you suspect that equipment might be biassed, you can use relative frequency to estimate the actual probability of each outcome. This involves doing the experiment many times and recording your results.
The relative frequency formula
The relative frequency of a result tells you how often that result happened compared to the total number of trials:
Working with relative frequency
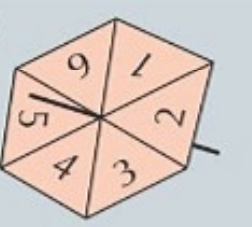
Let's say you spin a spinner 100 times and record how many times each number comes up:
| Score | Frequency | |
|---|---|---|
| 1 | 3 | |
| 2 | 14 | |
| 3 | 41 | |
| 4 | 20 | |
| 5 | 18 | |
| 6 | 4 |
To find the relative frequency of each score, you divide each frequency by the total number of spins (100):
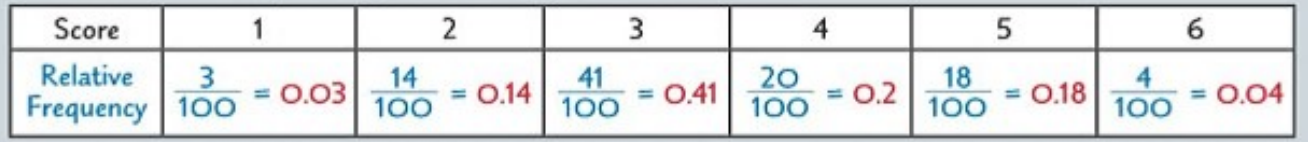 Here's the table written out clearly:
| Score | Relative Frequency |
|---|---|
| 1 | 3/100 = 0.03 |
| 2 | 14/10 = 0.14 |
| 3 | 41/100 = 041 |
| 4 | 20/100 = 0.2 |
| 5 | 18/100 = 0.18 |
| 6 | 4/100 = 0.04 |
Using relative frequency to estimate probability
Once you've calculated the relative frequency, you can use this as an estimate for the probability of that result. For example, if the relative frequency of getting a 3 is 0.41, then you can estimate that the probability of getting a 3 is about 0.41 or 41%.
The importance of repetition
The more times you repeat an experiment, the more accurate your estimate of the probability becomes. If you only rolled a dice 10 times, your results might be quite different from the true probability. But if you rolled it 1000 times, your relative frequencies would be much closer to the actual probabilities.
Checking if equipment is fair or biassed
You can use relative frequency to determine whether equipment is fair or biassed:
- If the equipment is fair, you'd expect all outcomes to have similar relative frequencies
- If the relative frequencies are very different from what you'd expect, the equipment is probably biassed
Worked Example: Checking if a Spinner is Fair
With a fair six-sided spinner, you'd expect each number to have a relative frequency of about .
If one number has a much higher relative frequency (like 0.41), then the spinner is likely biassed.
Recording results with frequency trees
When your experiment has two or more steps, you can record the results using frequency trees. These help you organise the data and calculate relative frequencies for different combinations of outcomes.
How frequency trees work
A frequency tree starts with the total number of trials and then branches out to show the different outcomes at each step. Each branch shows how many times that particular outcome occurred.
Calculating relative frequencies from frequency trees
Once you've completed your frequency tree, you can calculate the relative frequency of each final outcome by dividing the frequency of that outcome by the total number of trials.
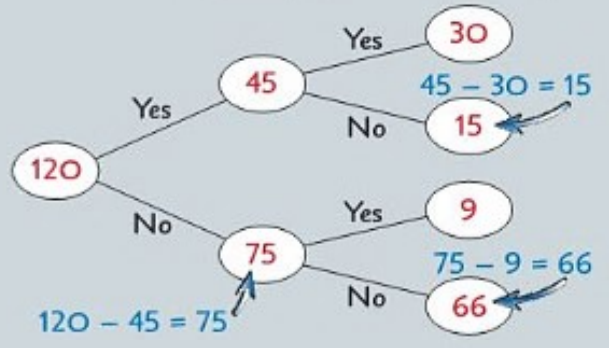
Worked Example: Using Frequency Trees
If 120 students were surveyed about whether they would take A-level maths, and then whether they actually did:
- 30 students said yes and did take A-level maths
- The relative frequency would be
Expected frequency calculations
Sometimes you want to predict how many times something will happen if you know the probability. This is called the expected frequency.
The expected frequency formula
Using expected frequency
Worked Example: Calculating Expected Frequency
If you know that the probability of rolling a 5 or 6 on a fair dice is , and you're going to roll the dice 180 times, you can calculate:
Expected number of times you'll roll a 5 or 6 =
When you don't know the probability
If you don't know the exact probability of a result, you can estimate it using relative frequency from previous experiments. Then you can use this estimated probability to calculate expected frequencies for future experiments.
For instance, if previous experiments showed that a biassed dice had a relative frequency of 0.41 for rolling a 3, you could estimate that in 500 rolls, you'd expect about threes.
Key Points to Remember:
- Fair equipment gives each outcome an equal chance, while biased equipment gives some outcomes a better chance than others
- Relative frequency = Frequency ÷ Total number of trials - use this to estimate probabilities when equipment might be biassed
- The more times you repeat an experiment, the more accurate your probability estimates become
- Frequency trees help you organise results from multi-step experiments and calculate combined probabilities
- Expected frequency = Probability × Number of trials - use this to predict future outcomes when you know the probability