Distance-Time Graphs (AQA GCSE Physics Combined Science): Revision Notes
📚 Revision Notes
5.6.8 Distance-Time Graphs
Distance-Time Graphs
Overview
Note
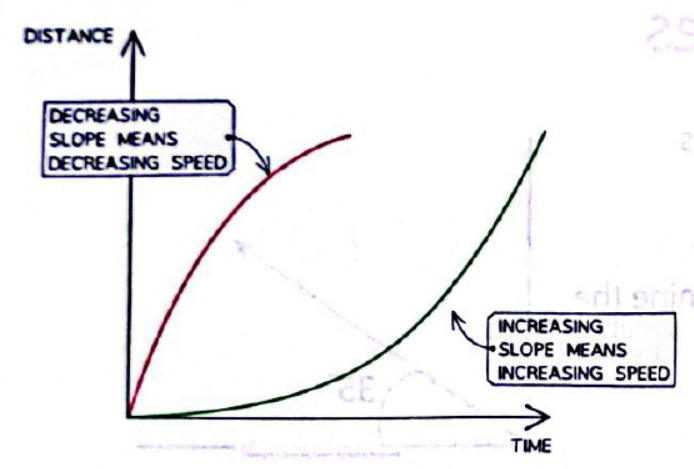
If an object moves along a straight line, the distance travelled can be represented by a distance-time graph.
Interpretation
Note
The increasing or decreasing speed means that the object is accelerating or decelerating.
- To calculate the speed at any given point:
- Draw a tangent to that point on the curve.
- Calculate the gradient of the tangent.
Gradient
- The gradient of a distance-time graph is the speed of the object.
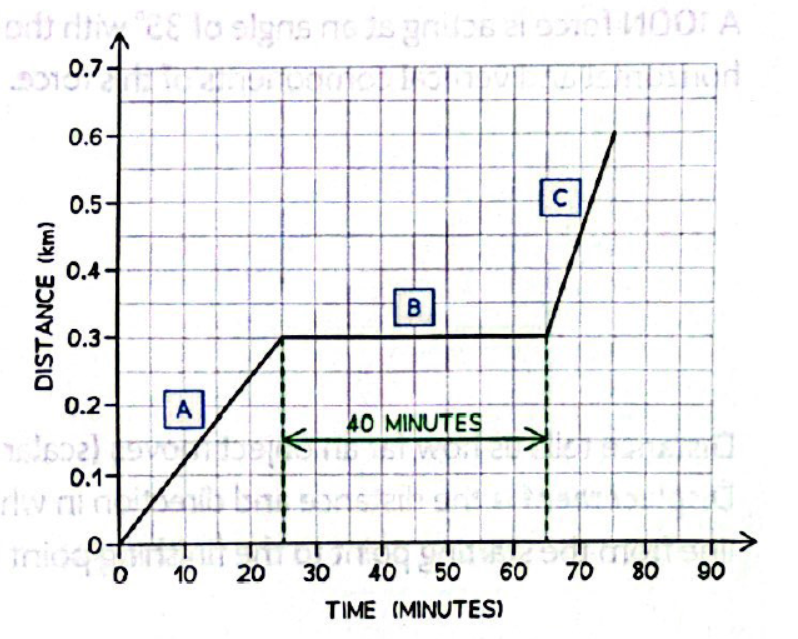
Example
Example Graph
- A: Represents a period of constant speed.
- B: Represents a period of rest (no movement).
- C: Represents a period of increasing speed.
Note
Note: The slope (steepness) of the graph indicates the speed; steeper slopes represent higher speeds.
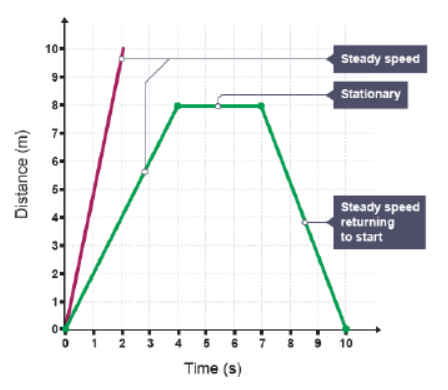
Displacement-Time Graphs
- Gradient is Velocity
- A sharper gradient means faster speed.
- The negative gradient is returning back to the starting point.
- Horizontal line means stationary.
- 0 distance means that it is back to the starting point.
- The area under the line = nothing.
- A curved line means that the velocity is changing (acceleration).
Acceleration
Note
If an object is accelerating, its speed can be determined by drawing a tangent and calculating the gradient of the distance-time graph.