Velocity-Time Graphs (AQA GCSE Physics): Revision Notes
📚 Revision Notes
5.6.11 Velocity-Time Graphs
Velocity-Time Graphs
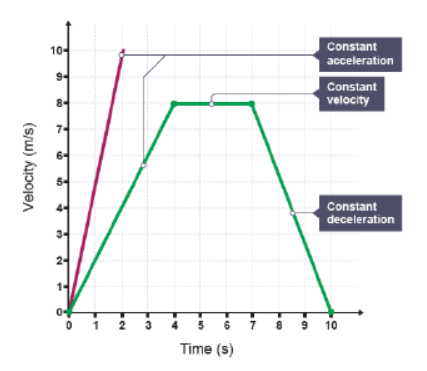
The gradient of a line on a velocity-time graph represents acceleration:
- The gradient is the steepness of the line. It shows how quickly the velocity is changing. A steeper (sharper) gradient means greater acceleration.
- A negative gradient (a line sloping downwards) indicates deceleration, meaning the object is slowing down.
- A horizontal line means the velocity is constant, so the object is moving at a steady speed.
- If the line is at 0 velocity (on the x-axis), the object is stationary.
The area under the line on a velocity-time graph represents the distance travelled:
- For straight lines, you can calculate this area using geometry (e.g., rectangles or triangles).
- For a curved line, counting the squares under the curve is often the best method to estimate the distance.
- A curved line on the graph indicates that the acceleration is changing. The object's speed is not increasing or decreasing at a constant rate.
Average Speed
Note
Average speed is calculated when the speed changes during the motion.
Note
To find the average speed, divide the total distance travelled by the total time taken.