Calculating Spearman's rank correlation coefficient (AQA GCSE Statistics): Revision Notes
Calculating Spearman's rank correlation coefficient
Spearman's rank correlation coefficient is a statistical measure that helps you determine the strength and direction of the relationship between two sets of data. Unlike Pearson's correlation, Spearman's works with ranked data rather than the actual values, making it particularly useful when dealing with non-linear relationships or when you want to focus on the order of the data rather than the precise values.
What is Spearman's rank correlation coefficient?
The Spearman's rank correlation coefficient (written as rs) measures how closely two variables are related when we consider their ranks rather than their actual values. The coefficient will always be between -1 and +1:
- rs = +1: Perfect positive correlation (as one variable increases in rank, the other increases proportionally)
- rs = -1: Perfect negative correlation (as one variable increases in rank, the other decreases proportionally)
- rs = 0: No correlation (no relationship between the ranks)
- rs close to +1 or -1: Strong correlation
- rs close to 0: Weak correlation
The beauty of Spearman's correlation is that it focuses on the relative ordering of data points rather than their exact values, making it robust against outliers and suitable for ordinal data.
The step-by-step method
Step 1: Ranking your data
Before you can calculate Spearman's correlation coefficient, you need to convert your data values into ranks. Here's how to do this properly:
- For each variable separately, arrange the values in order from smallest to largest
- Give the smallest value rank 1, the next smallest rank 2, and so on
- If you have tied values (identical numbers), give them the average of the ranks they would have occupied
Handling Tied Values: If two values are identical and would occupy ranks 3 and 4, both get rank 3.5 (the average of 3 and 4). This ensures fair ranking when dealing with duplicate values.
Step 2: Calculate the differences
Once you have ranked both sets of data:
- Find the difference (d) between each pair of ranks
- Square each difference to get d²
- Add up all the d² values to get Σd²
Step 3: Apply the formula
The formula for Spearman's rank correlation coefficient is:
Where:
- rs = Spearman's rank correlation coefficient
- Σd² = sum of all the squared differences
- n = number of pairs of data
Worked example: tyre age and stopping distance
Let's work through a complete example using data about car tyre age and stopping distances.
Worked Example: Calculating Spearman's Correlation
Here's how to solve this step by step:
Step 1: Rank the data
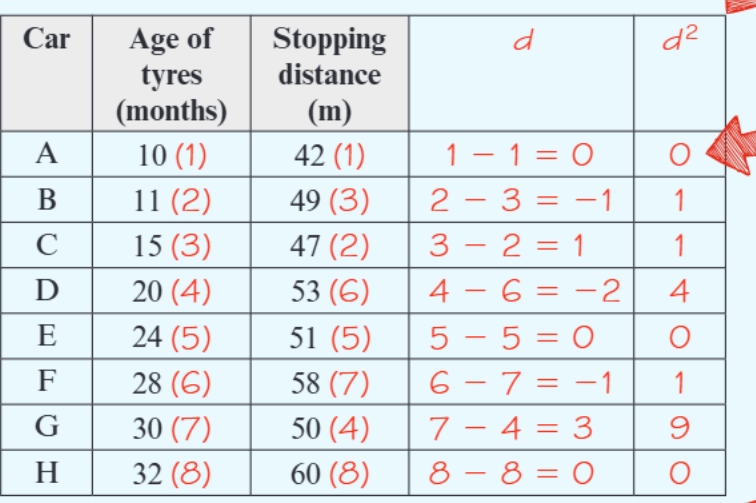
- Tyre age ranks: Car A (10 months) gets rank 1, Car B (11 months) gets rank 2, and so on up to Car H (32 months) getting rank 8
- Stopping distance ranks: Car A (42m) gets rank 1, Car C (47m) gets rank 2, and so on
Step 2: Calculate differences and d² For each car, subtract the stopping distance rank from the age rank:
- Car A: 1 - 1 = 0, so d² = 0
- Car B: 2 - 3 = -1, so d² = 1
- Car C: 3 - 2 = 1, so d² = 1
- Car D: 4 - 6 = -2, so d² = 4
- Car E: 5 - 5 = 0, so d² = 0
- Car F: 6 - 7 = -1, so d² = 1
- Car G: 7 - 4 = 3, so d² = 9
- Car H: 8 - 8 = 0, so d² = 0
Step 3: Apply the formula Σd² = 0 + 1 + 1 + 4 + 0 + 1 + 9 + 0 = 16
Step 4: Interpret the result The value of 0.81 shows a strong positive correlation between tyre age and stopping distance. This means that as tyres get older, the stopping distance tends to increase, which makes practical sense from a safety perspective.
Key Exam Tips:
-
Always show your working: In GCSE exams, you must write down all your calculations clearly. The examiners want to see your ranking process, your difference calculations, and your formula application.
-
Write ranks beside values: A helpful technique is to write the ranks in brackets next to the original values in your table. This makes it easier to see what you're working with and reduces errors.
-
Add an extra row for d²: When creating your working table, include separate columns for d and d² values. This helps you stay organised and makes it easier for examiners to follow your method.
-
Check your arithmetic: Double-check your addition of d² values, as small arithmetic errors can significantly affect your final answer.
-
Interpret your answer: Don't just calculate the coefficient - always explain what it means in the context of the question. Describe whether the correlation is strong, moderate, or weak, and whether it's positive or negative.
Common Exam Traps to Avoid:
- Forgetting to rank the data first: You cannot use the original values directly in the formula
- Making errors when ranking tied values: If two values are the same, they should get the average of the ranks they would occupy
- Arithmetic mistakes: Take extra care when squaring negative differences and adding up your d² values
- Misinterpreting the result: Remember that correlation does not imply causation - just because two things are correlated doesn't mean one causes the other
Key Points to Remember:
- Spearman's rank correlation coefficient measures the strength of relationship between ranked data
- The formula is
- Values range from -1 to +1, where values closer to ±1 indicate stronger correlations
- Always rank your data first, then calculate differences between ranks
- Show all working clearly in exams and interpret your final answer in context