Causal relationships (AQA GCSE Statistics): Revision Notes
Causal relationships
What is a causal relationship?
A causal relationship exists between two variables when a change in one variable directly causes a change in the other variable. This means there's a genuine cause-and-effect connection where one factor actually influences the other.
Examples of true causal relationships include:
- The number of hours of sunshine and temperature
- The age of a car and its value (older cars typically decrease in value)
Understanding causal relationships is crucial because it helps us predict what will happen when we change one variable, and it allows us to make informed decisions based on genuine cause-and-effect connections.
Understanding correlation vs causation
This is one of the most important concepts you need to master. Correlation between two variables shows that there may be a relationship between them, but it does not mean that a change in one variable caused the change in the other.
The key rule to remember is: correlation does not necessarily imply causation.
When you see two variables that appear to be related on a scatter diagram, you must always ask yourself: "Is there actually a direct cause-and-effect relationship, or could there be another explanation?"
Real-world examples
Temperature and seasonal sales
Let's examine two scatter plots that show strong positive correlations:
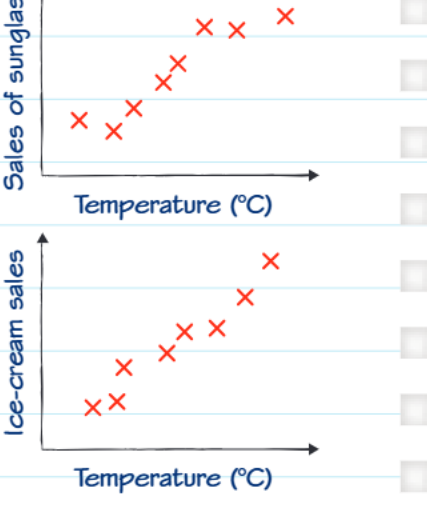
Both graphs show clear positive correlations:
- As temperature increases, sunglasses sales increase
- As temperature increases, ice-cream sales increase
You might initially think that sunglasses sales cause ice-cream sales to increase, since both follow the same pattern. However, this would be incorrect reasoning.
The truth is that temperature is the causal factor affecting both variables. As the weather gets warmer:
- More people want to protect their eyes from bright sunshine → increased sunglasses sales
- More people want cold refreshments → increased ice-cream sales
There's no direct causal relationship between sunglasses and ice-cream sales. They're both affected by the same underlying factor: temperature. This is called a third variable or confounding factor.
The umbrella and road accidents case study
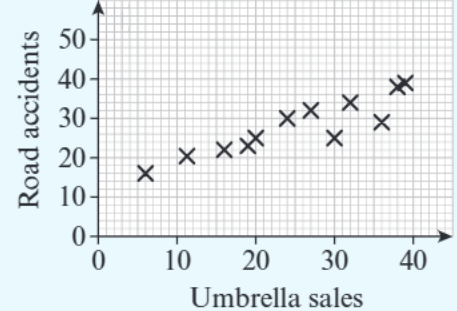
This scatter plot shows a positive correlation between umbrella sales and the number of road accidents. At first glance, someone might incorrectly conclude that buying umbrellas causes road accidents!
Worked example walkthrough
Let's analyse the umbrella and road accidents example step by step:
Worked Example: Analysing Correlation vs Causation
The scenario: A scatter diagram shows the numbers of umbrellas sold and the numbers of road accidents in a town over a 12-month period. There is a positive linear correlation between the number of umbrellas sold and the number of road accidents.
Student's claim: David thinks there is a causal relationship between these two variables.
Question: Is David correct? Give reasons for your answer.
Step-by-step analysis:
-
Identify what the correlation shows: The data shows that as umbrella sales increase, road accidents also tend to increase.
-
Consider if there's direct causation: Ask yourself - does buying an umbrella directly cause a road accident? This seems highly unlikely.
-
Look for a third variable: What could cause both umbrella sales AND road accidents to increase together?
-
Find the real cause: The answer is weather conditions, particularly rain:
- When it rains more → people buy more umbrellas
- When it rains more → driving conditions become more dangerous → more accidents occur
-
Conclusion: Both variables are affected by the same underlying factor (weather/rain), but one doesn't cause the other.
Answer: No, David is not correct. Buying an umbrella does not cause a road accident. There is not a causal relationship between the two variables. Both variables are affected by the weather, and by rain in particular.
Common exam mistakes to avoid
Watch out for these common pitfalls:
-
Assuming correlation means causation: Just because two variables increase or decrease together doesn't mean one causes the other.
-
Not looking for third variables: Always consider what other factors might be influencing both variables.
-
Accepting unrealistic cause-and-effect relationships: Use common sense - does the proposed causal relationship actually make logical sense?
-
Not explaining your reasoning clearly: In exam questions, you must explain WHY there isn't a causal relationship and identify the real underlying factor.
Key exam tips
Essential exam strategies:
- When you see a correlation between two variables, always ask: "What third factor could be causing both of these to change?"
- Look for seasonal patterns, weather effects, economic factors, or other underlying influences
- Remember that correlation ≠ causation - this is a fundamental principle you must never forget
- In written answers, clearly state that there's no causal relationship and explain what the real cause is
- Use phrases like "Both variables are affected by..." or "The underlying cause is..."
Remember!
Key Points to Remember:
- Causal relationships involve direct cause-and-effect - one variable genuinely influences the other
- Correlation does NOT necessarily imply causation - this is the golden rule of statistics
- Always look for third variables that might be affecting both variables simultaneously
- Weather, seasons, and economic factors are common third variables that create misleading correlations
- In exams, explain your reasoning clearly - state why there's no causation and identify the real underlying cause