Pearson's product moment correlation coefficient (AQA GCSE Statistics): Revision Notes
Pearson's product moment correlation coefficient
What is Pearson's product moment correlation coefficient?
Pearson's product moment correlation coefficient, abbreviated as PMCC and represented by the symbol , is a statistical measure that helps us understand how strongly two sets of data are related to each other in a linear way. Think of it as a tool that tells us whether two variables move together in a straight-line pattern.
The key word here is "linear" - PMCC specifically looks for straight-line relationships between data points. This is what makes it different from other correlation measures you might encounter.
When we calculate PMCC, we're essentially asking: "If I drew the best straight line through my data points, how close would all the points be to that line?"
Understanding the value range and interpretation
The PMCC always gives us a value between -1 and +1, and this number tells us everything we need to know about the strength and direction of the relationship.
Here's how to interpret the values:
Strong positive correlation (r close to +1):
- As one variable increases, the other increases too
- Data points lie very close to a straight line sloping upwards
- The closer to +1, the stronger the positive relationship
No correlation (r close to 0):
- There's no clear linear relationship between the variables
- Data points are scattered randomly
- One variable doesn't predict the other
Strong negative correlation (r close to -1):
- As one variable increases, the other decreases
- Data points lie very close to a straight line sloping downwards
- The closer to -1, the stronger the negative relationship
The further the PMCC value is from 0 (in either direction), the stronger the correlation becomes.
Comparing PMCC with Spearman's rank correlation coefficient
It's important to understand how PMCC relates to Spearman's rank correlation coefficient, as you'll often see both mentioned together.
Key differences
PMCC focuses on linear relationships only. It specifically measures how well data fits a straight line pattern. If your data follows a curved pattern, PMCC might not capture the relationship accurately.
Spearman's rank correlation coefficient is more flexible. It can detect any type of relationship, whether it's a straight line, a curve, or any other consistent pattern. It works by ranking the data points rather than using their actual values.
Important similarities
Both measures use the same scale from -1 to +1, and both get stronger as they move away from 0. The interpretation of positive and negative values is identical for both measures.
Understanding the relationship between PMCC and Spearman's:
When data points form perfect straight lines, both PMCC and Spearman's give identical results. However, when the relationship is slightly curved or non-linear, you might see different values between the two measures.
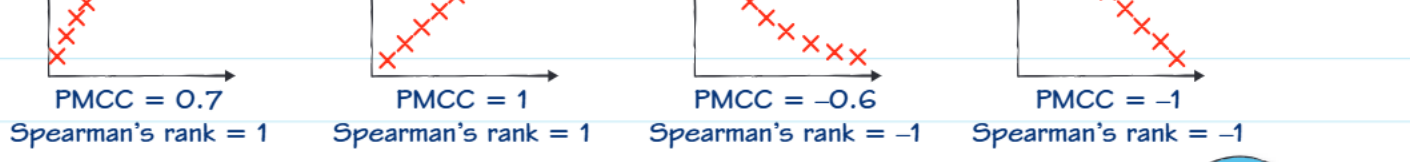
Looking at these scatter plots, you can see how the two measures compare. Notice that when data points form perfect straight lines, both PMCC and Spearman's give identical results. However, when the relationship is slightly curved or non-linear, you might see different values.

This reference table shows the scale that both correlation coefficients use, with important threshold values highlighted.
Worked example walkthrough
Let's examine a practical example to see how PMCC works in real situations.
Worked Example: Interpreting Correlation Coefficients from Scatter Plot Data
The problem: Statistical software calculated both Spearman's rank correlation coefficient and Pearson's product moment correlation coefficient for a dataset shown in a scatter diagram. We need to identify the most likely pair of correlation coefficients.
Looking at the scatter plot in the example, we can see the data points form a clear upward trend, indicating a positive correlation. However, the points don't lie perfectly on a straight line - there's some curvature to the pattern.
The solution process:
Step 1: Identify the correlation direction - The data clearly shows a positive relationship (both coefficients should be positive)
Step 2: Consider the data pattern - The points follow an upward curve rather than a perfect straight line
Step 3: Apply our understanding:
- Spearman's rank correlation = 1 (because the rank orders are perfectly consistent)
- PMCC = 0.8 (strong but not perfect, because the linear fit isn't perfect)
Why these values make sense: Both correlation coefficients are positive, confirming the positive relationship. Spearman's gives a perfect score of 1 because the rank orders of the x and y values match exactly. PMCC gives 0.8 because while there's a strong linear trend, the data points don't lie exactly on a straight line due to the slight curvature.
Key problem-solving approach
Systematic Approach to PMCC Problems:
When dealing with PMCC questions in exams, follow these steps:
- Look at the scatter plot first - identify whether the relationship appears linear, curved, or scattered
- Determine the direction - positive (upward slope) or negative (downward slope)
- Assess the strength - how closely do points follow the linear pattern?
- Consider the context - what do the variables represent, and does the correlation make sense?
- Compare with other measures - if Spearman's is also given, think about why they might differ
Common exam tips and traps
Critical Exam Tip: Remember that PMCC measures LINEAR correlation only. If data follows a perfect curve, PMCC might be low even though there's a strong relationship.
Additional Tips for Success:
Common trap: Don't confuse correlation with causation. A high PMCC doesn't mean one variable causes the other to change.
Memory aid: Think "Pearson = Perfectly straight line preference" - it works best with linear relationships.
Key Points to Remember:
- PMCC () always lies between -1 and +1, measuring the strength of linear relationships only
- Values close to +1 indicate strong positive linear correlation, close to -1 indicate strong negative linear correlation, and close to 0 indicate no linear relationship
- PMCC differs from Spearman's because it specifically looks for straight-line patterns, while Spearman's can detect any consistent relationship
- The further the PMCC value is from 0, the stronger the linear correlation becomes
- Always consider the context of your data when interpreting correlation coefficients