The equation of a line of best fit (AQA GCSE Statistics): Revision Notes
Regression line
What is a regression line?
A regression line is also known as the line of best fit. This is a straight line drawn through the middle of the points on a scatter diagram to show the general trend or pattern in the data. The regression line helps us understand the relationship between two variables and allows us to make predictions about one variable based on the value of another.
When you have the equation of a regression line, you can use it to find specific points that lie on the line and draw it accurately on a scatter diagram.
The equation of a regression line
Regression lines follow the standard straight line equation format:
Where:
- m is the gradient (slope) of the line
- c is the y-intercept (where the line crosses the y-axis)
- x and y are the coordinates of points on the line
Using the equation to find points on the line
To draw a regression line on a scatter diagram, you need to find at least two points that lie on the line using the equation. Here's how to do it step by step:
Worked Example: Academic Performance
Let's say we have data about students' performance in maths and science tests, and the regression line has the equation:
Where = maths mark (%) and = science mark (%)
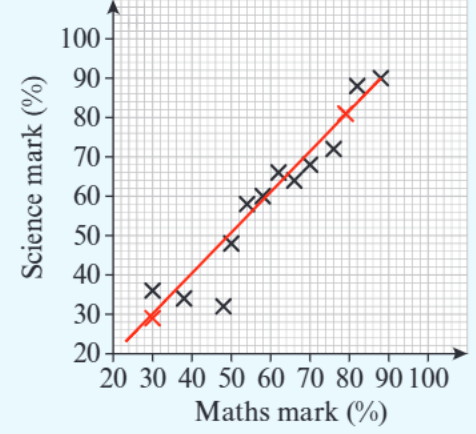
Step 1: Choose suitable x-values Pick x-values that are easy to work with and spread across the range of your data. Good choices might be and .
Step 2: Calculate the corresponding y-values
When :
When :
Step 3: Plot and join the points Plot the points and on your scatter diagram, then draw a straight line through them.
Interpreting the components of the equation
The y-intercept (c-value)
The y-intercept tells you where the regression line crosses the y-axis (when ). In our example, , which means the line crosses the y-axis at .
What this means in context: If a student scored 0% on the maths test, the regression line predicts they would score -3% on the science test. However, this is impossible since you can't score negative marks, which shows that the regression line may not be reliable for predicting values outside the range of the original data.
The gradient (m-value)
The gradient shows how much y increases for every 1-unit increase in x. In our example, .
What this means in context: For every extra 1% scored on the maths test, a student would be expected to score 1.05% more on the science test. This positive gradient indicates a positive correlation between maths and science performance.
Making predictions using regression lines
Regression lines can be used to make predictions, but you must consider their reliability:
Worked Example: Car Depreciation
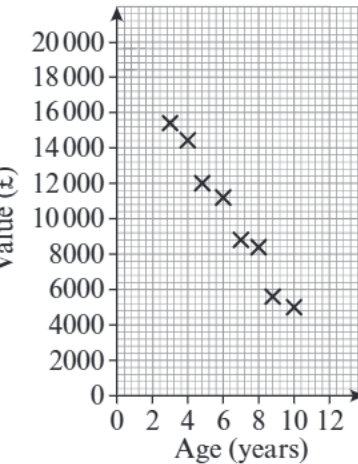
If we have a regression line with equation , where = age of car (years) and = value (£):
- The y-intercept (20000) represents the car's initial value when new
- The gradient (-1500) shows the car loses £1500 in value each year
- We can predict the car's value after any number of years
However, predictions become less reliable the further they are from the original data range.
Key points about reliability
When using regression lines for predictions:
- Stay within the data range: Predictions are most reliable when made within the range of the original data
- Consider the context: Sometimes predictions may give impossible or unrealistic results
- Correlation doesn't mean causation: A strong correlation doesn't necessarily mean one variable causes changes in the other
- Check the scatter: If the points are very spread out from the line, predictions will be less reliable
Drawing regression lines step by step
- Identify the equation of the regression line
- Choose two x-values that are easy to substitute and cover a good range
- Calculate the corresponding y-values using the equation
- Plot both points on the scatter diagram
- Draw a straight line through both points, extending it across the diagram
- Check your line passes close to the middle of the scattered data points
Key Points to Remember:
- The regression line is the same as the line of best fit and shows the general trend in scattered data
- Use the equation to find points on the line by substituting x-values
- The gradient (m) tells you how much y changes for each unit increase in x
- The y-intercept (c) shows where the line crosses the y-axis when
- Predictions are most reliable within the range of the original data and may become unrealistic outside this range