Equation (AQA GCSE Statistics): Revision Notes
Equation
Understanding the line of best fit equation
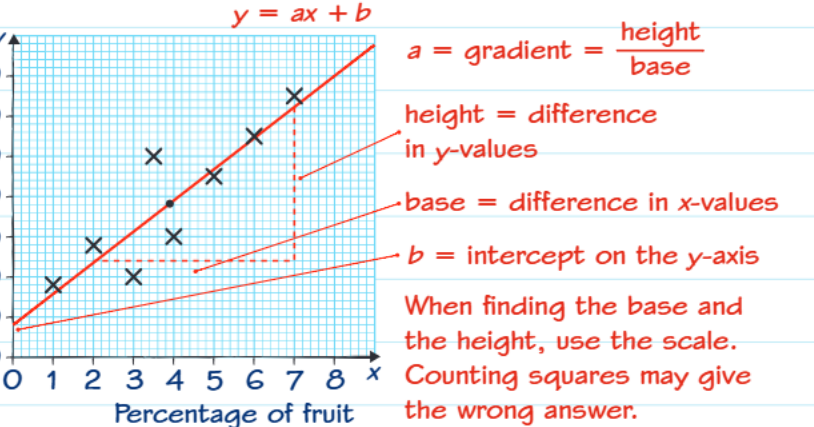
The equation of a line of best fit follows the standard linear format y = axe + b, where:
- a represents the gradient (or slope) of the line
- b represents the y-intercept (where the line crosses the y-axis)
This equation allows you to predict values and understand the relationship between two variables in your data.
The linear equation is fundamental to understanding relationships between variables in data analysis. Once you have this equation, you can predict any y-value for a given x-value within your data range.
Finding the gradient (value of a)
The gradient measures how steep your line is and shows the rate of change between your variables. Here's how to calculate it:
Step 1: Choose two clear points on your line of best fit Step 2: Draw a right-angled triangle between these points Step 3: Calculate using the formula:
Gradient = height ÷ base
Where:
- Height = difference in y-values (vertical change)
- Base = difference in x-values (horizontal change)
Critical Exam Tip: Always use the scale on the axes rather than counting grid squares. Counting squares often leads to incorrect answers because the scale might not match the grid spacing.
Finding the y-intercept (value of b)
The y-intercept is the value of y when x equals zero. You can find this by:
Method 1: Reading directly from the graph where the line crosses the y-axis Method 2: Using the rearranged formula:
Pick any point on the line, substitute the coordinates and the gradient you've calculated, then solve for b.
Understanding correlation and gradient relationship
The type of correlation in your data directly affects the sign of your gradient:
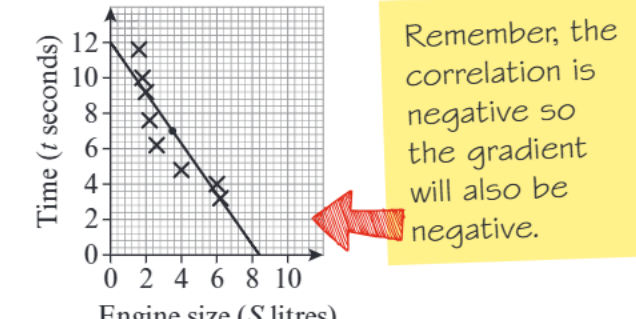
- Positive correlation: As one variable increases, the other increases too. The gradient will be positive
- Negative correlation: As one variable increases, the other decreases. The gradient will be negative
Step-by-step worked example
Let's work through finding the equation for a line showing the relationship between temperature and drink sales:
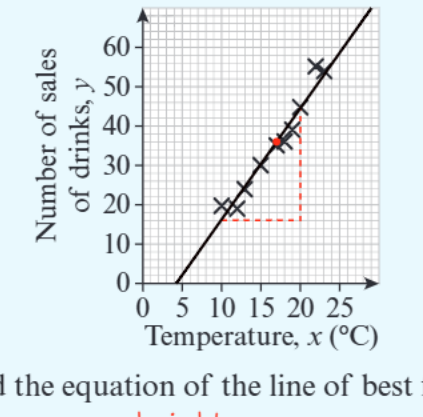
Worked Example: Finding the Line of Best Fit Equation
Step 1: Find the gradient
- Choose two points on the line: (10, 16) and (20, 45)
- Height = 45 - 16 = 29
- Base = 20 - 10 = 10
- Gradient = 29 ÷ 10 = 2.9
Step 2: Find the y-intercept
- Using point (10, 16) and gradient 2.9
Step 3: Write the equation
Interpreting the gradient in context
Don't just calculate the gradient - understand what it means! In our temperature and drinks example:
The gradient of 2.9 tells us that for each 1°C increase in temperature, approximately 2.9 more drinks are sold.
This contextual interpretation is often worth marks in exams and shows you understand the real-world meaning behind the mathematics.
Always ask yourself: "What does this gradient mean in the real situation?" This demonstrates deeper understanding and can earn you valuable marks in examinations.
Common exam tips and traps
Critical Points to Avoid Common Mistakes:
- Scale vs squares: Always use the axis scale, not grid squares
- Sign awareness: Check whether your correlation should give a positive or negative gradient
- Context interpretation: Be ready to explain what your gradient means in the real situation
- Point selection: Choose points that lie clearly on your line, preferably where the line passes through grid intersections
Key Points to Remember:
- The equation format is always
- Gradient = height ÷ base using two points on the line
- Positive correlation means positive gradient, negative correlation means negative gradient
- Use the scale on axes, never count grid squares
- Always interpret your gradient in the context of the original problem