The UK's climate (Edexcel GCSE Geography A): Revision Notes
The UK's climate
Introduction
The United Kingdom experiences a distinctive climate that has evolved and changed significantly over the past thousand years. Our climate varies considerably from one region to another due to various geographical factors, making it an interesting case study in how location influences weather patterns.
Historical climate patterns
Britain's climate has undergone notable changes throughout history, demonstrating that climate systems are dynamic rather than static.
During the Medieval Warm Period (950-1100), our climate was considerably warmer than today. This period brought higher temperatures that led to improved agricultural conditions, resulting in better crop harvests and population growth. The warmer conditions were attributed to increased solar radiation reaching Earth during this time.
The Mediaeval Warm Period was so warm that Vikings were able to establish settlements in Greenland, and vineyards flourished as far north as southern England. This demonstrates just how significant these historical climate variations were.
In contrast, the Little Ice Age (1600-1685) brought much colder conditions to Britain. Temperatures dropped so significantly that the River Thames regularly froze over completely during winter months. This period saw reduced volcanic activity and decreased solar radiation, creating the opposite effect of the earlier warm period.
Current UK climate characteristics
Today, Britain has what geographers classify as a temperate, wet climate. This means we experience moderate temperatures year-round with significant rainfall. While extreme weather events do occur, they are relatively uncommon compared to many other parts of the world. However, the meeting of different air masses over our islands frequently creates frontal rainfall, which explains why rain is such a regular feature of British weather.
The UK's temperate climate means that extreme weather is rare, but the meeting of major air masses makes frontal rainfall common. This is why we experience relatively predictable but frequently wet conditions.
Factors influencing the UK's climate
Five Key Factors Shape UK Climate: Understanding these five geographical factors is essential for explaining why the UK has its distinctive weather patterns. Each factor works together with the others to create our unique climate system.
Five main geographical factors work together to create our distinctive climate patterns:
1. Maritime influence
Being an island nation surrounded by water has a profound impact on our weather. The seas around Britain mean that most air reaching our shores contains high levels of moisture. This maritime influence explains why we experience rainfall throughout the year, rather than having distinct wet and dry seasons like some continental climates.
2. Prevailing winds
The dominant wind direction in the UK comes from the south-west. These prevailing winds travel great distances across the Atlantic Ocean, picking up moisture as they go. When these moisture-laden winds reach Britain, they bring the wet conditions we're famous for.
3. North Atlantic Drift
This crucial ocean current transports warm water northwards from the tropics towards the UK. The North Atlantic Drift acts like a giant heating system, making our winters much milder than they would otherwise be for our latitude. Without this warm current, Britain would experience much harsher winter conditions similar to other places at the same latitude, such as Labrador in Canada.
The North Atlantic Drift is so important that without it, London would have a climate similar to Labrador in Canada, which is at the same latitude but experiences much colder winters with temperatures often below -20°C.
4. Atmospheric circulation
The UK sits in a particularly important position regarding global air circulation patterns. We're located near the boundary between two major circulation cells - the Ferrel cell and the Polar cell. This position means that warm air from the south frequently meets cooler air from the north over Britain, creating the unsettled weather conditions we often experience.
5. Altitude effects
Height above sea level significantly influences local climate conditions. As altitude increases, both temperature and precipitation change predictably. Higher areas tend to be cooler and wetter than lower-lying regions, which explains why mountainous areas of Scotland and Wales typically experience different conditions from coastal plains.
Regional climate variations
The combination of these five factors creates distinct regional differences across the UK:
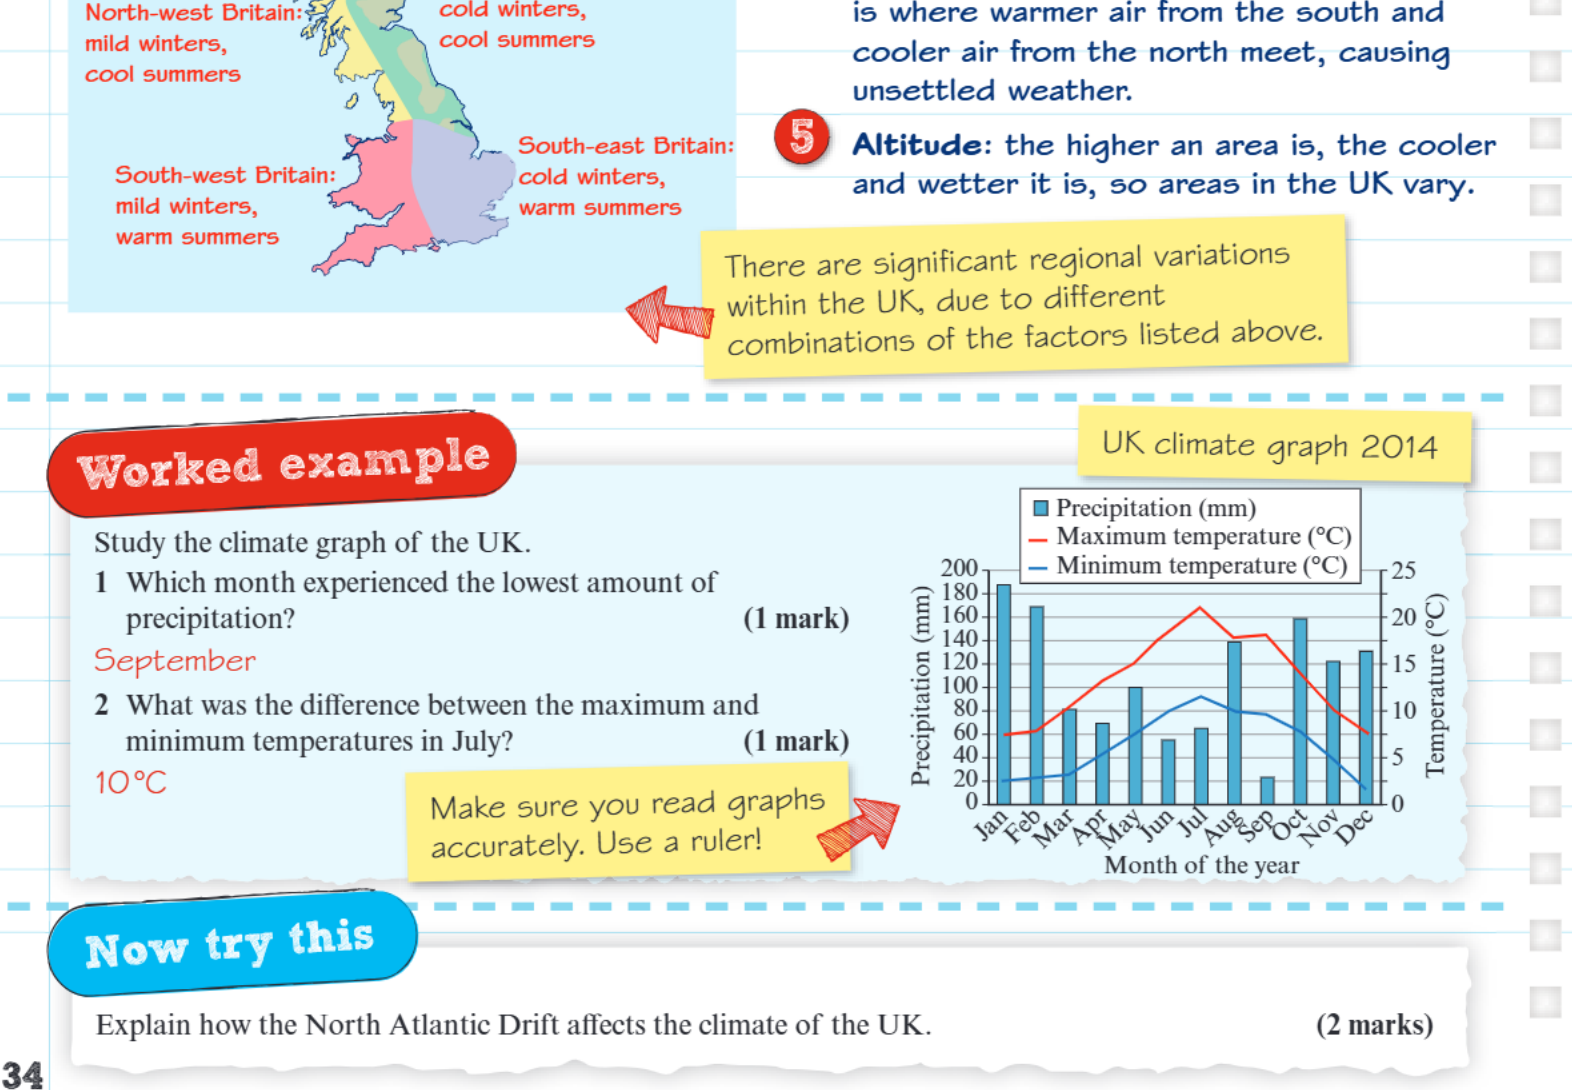
Northwest Britain (including Scotland and Northern Ireland) typically experiences mild winters and cool summers. The maritime influence is strongest here, and the effects of the North Atlantic Drift are most pronounced.
Southwest Britain (Cornwall, Devon, and parts of Wales) enjoys mild winters but benefits from warmer summers than the northwest. This region still receives significant maritime influence but is positioned to benefit from warmer air masses.
Southeast Britain experiences the most continental-style climate, with colder winters and warmer summers compared to western regions. Being further from the strongest maritime influences, this area shows greater temperature variation between seasons.
The contrast between regions is quite dramatic - while the northwest maintains relatively stable temperatures year-round due to maritime influence, the southeast can experience temperature swings of over 30°C between winter and summer extremes.
Understanding climate graphs
Climate graphs are essential tools for understanding regional weather patterns. They typically display both temperature (shown as lines) and precipitation (shown as bars) across the twelve months of the year. When reading these graphs, it's crucial to use a ruler for accuracy and pay careful attention to the different scales used for temperature and rainfall.
Worked Example: Reading Climate Data
When examining UK climate data from 2014:
Step 1: Identify the driest month Look at the precipitation bars - September recorded the lowest precipitation levels of the year.
Step 2: Find temperature variations Examine the temperature line - July showed a temperature range of 10°C between maximum and minimum daily temperatures.
Step 3: Use proper tools Always use a ruler when reading values from the graph axes to ensure accuracy.
Common Mistake to Avoid: Never estimate values from climate graphs by eye alone. Always use a ruler to read accurately from both the temperature and precipitation scales, as they often use different units and ranges.
Key Points to Remember:
- The UK's temperate, wet climate results from our island location and maritime influences
- Five key factors shape our climate: maritime influence, prevailing south-westerly winds, the North Atlantic Drift, atmospheric circulation patterns, and altitude effects
- Regional variations exist across the UK, with the northwest having mild winters and cool summers, while the southeast experiences more continental conditions
- Historical climate changes like the Mediaeval Warm Period and Little Ice Age show that climate systems naturally vary over time
- Reading climate graphs accurately requires careful attention to scales and using appropriate tools like rulers for precision