Distance-Time Graphs (Edexcel GCSE Maths): Revision Notes
Distance-time graphs
Distance-time graphs are a fundamental tool in GCSE mathematics that show how far an object travels over a period of time. These graphs appear frequently in exams, so understanding how to read and interpret them is essential for your success.
Distance-time graphs are one of the most commonly tested topics in GCSE mathematics. Mastering them will give you confidence in both your exams and real-world problem-solving situations.
Understanding the basics
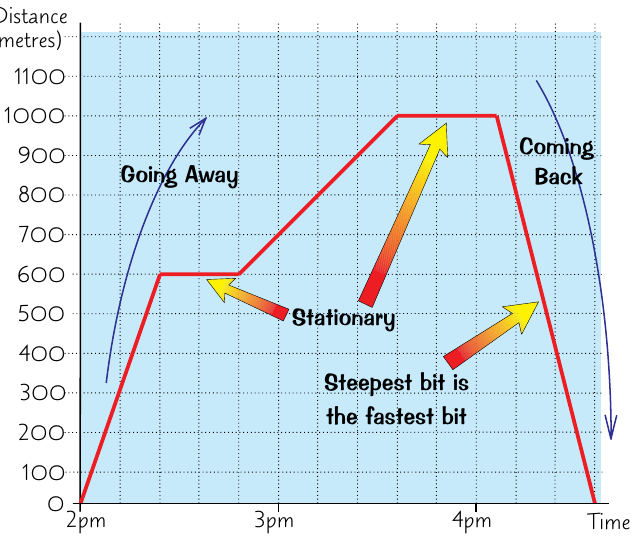
Distance-time graphs plot distance (usually on the y-axis) against time (usually on the x-axis). The line on the graph tells a story about a journey, showing when someone or something is moving, how fast they're travelling, and when they stop.
Three Critical Principles for Distance-Time Graphs:
1. The gradient equals speed At any point on the graph, the gradient (steepness) of the line represents the speed of travel. However, you must always pay attention to the units being used - they might be in metres per second, kilometres per hour, or other combinations.
2. Steeper lines mean faster movement The steeper the line appears on the graph, the faster the object is moving. A very steep line indicates high speed, while a gentle slope shows slower movement.
3. Flat sections show when movement has stopped When the line is completely horizontal (flat), this means the object has stopped moving. The distance remains constant during these periods, even though time continues to pass.
Reading distance-time graphs
When you encounter a distance-time graph, you can extract several pieces of information:
- Starting point: Where the journey begins (usually at the origin or y-intercept)
- Direction of travel: An upward slope means moving away from the starting point, while a downward slope indicates returning towards it
- Speed changes: Different gradients show when the speed increases or decreases
- Rest periods: Horizontal sections reveal when the traveller has stopped
Think of the graph as telling a story - each change in direction or steepness represents a different chapter in the journey. Practice reading these "stories" to become more confident with interpretation.
Calculating speed from graphs
The speed can be calculated using the fundamental formula:
To find the speed from a distance-time graph, you need to:
- Choose two points on the line
- Calculate the change in distance between these points
- Calculate the change in time between these points
- Divide the distance change by the time change
Worked example: Henry's cycling journey
Let's examine a practical example that demonstrates these principles in action.
Worked Example: Henry's Bike Journey
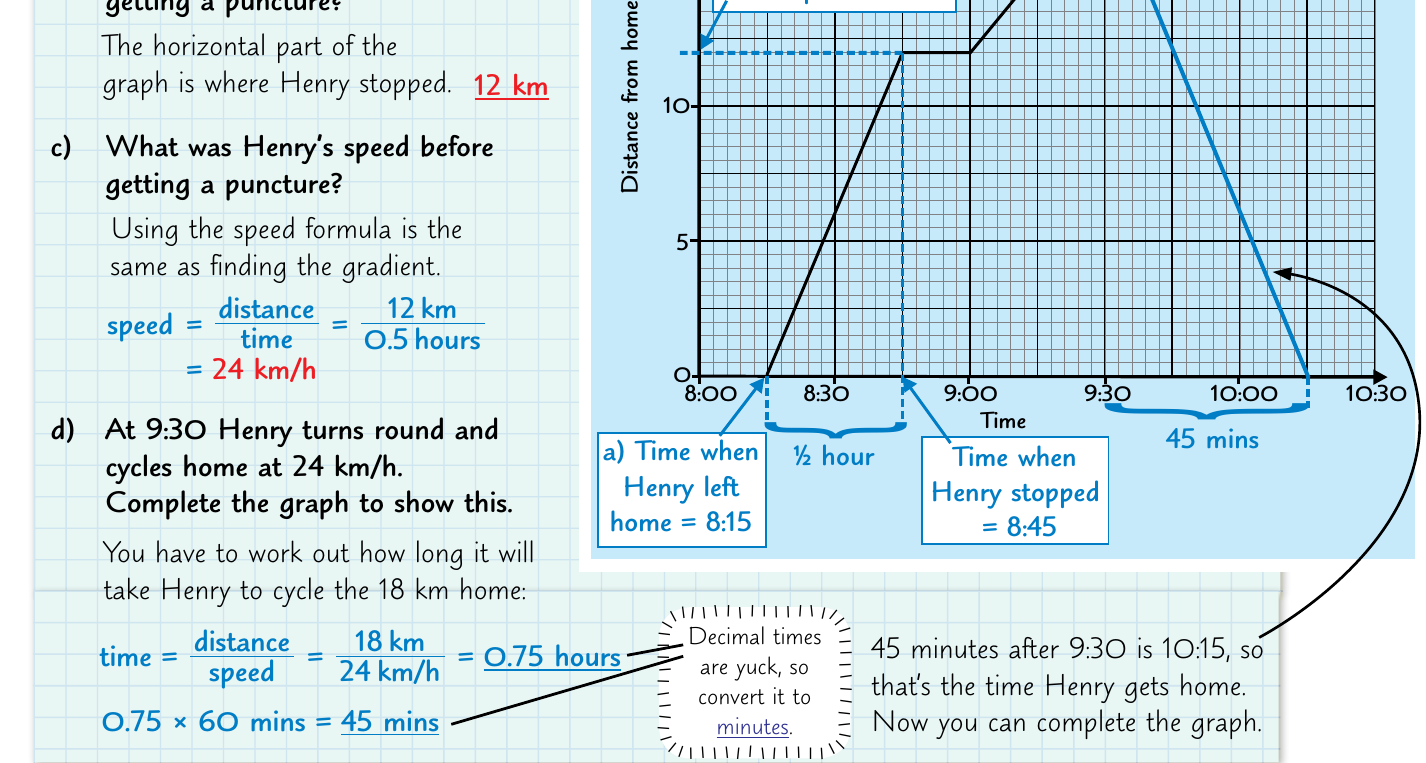
Henry goes out for a bike ride but gets a puncture and has to stop to fix it. The graph shows his complete journey and demonstrates several key concepts:
Step 1: Finding when Henry left home Look at where the line starts on the time axis. In this case, Henry left home at 8:15.
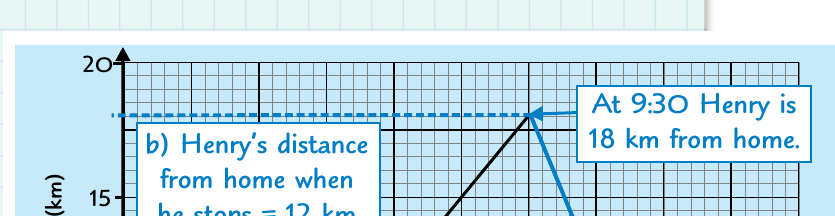
Step 2: Calculating distance travelled before the puncture The horizontal section of the graph shows where Henry stopped. He had travelled 12 km before getting the puncture.
Step 3: Working out Henry's initial speed Using the speed formula with the distance (12 km) and time (0.5 hours):
Step 4: Determining the return journey Henry cycles home at the same speed (24 km/h). To travel 18 km at this speed takes:
This example shows how distance-time graphs can represent real-world situations, including stops, changes in direction, and different phases of a journey.
Common features you'll encounter
Distance-time graphs often include these typical features:
Curved lines: These indicate changing speed (acceleration or deceleration). The steeper the curve becomes, the faster the acceleration.
Multiple segments: Real journeys often involve different speeds for different parts of the trip, creating graphs with several distinct sections.
Returning to origin: When someone returns to their starting point, the graph will end at the same distance value where it began.
Remember about units! Always check what units are being used for both distance and time. You might need to convert between metres and kilometres, or between seconds, minutes, and hours to get the correct answer.
Tips for success
The key to mastering distance-time graphs is practice and careful observation. Always start by identifying what each axis represents and what units are being used. Look for patterns in the line - where it's steep, where it's flat, and where it changes direction.
When solving problems, work systematically through each part of the journey, calculating speeds and times step by step. Remember that the gradient always gives you the speed, but you might need to convert units to get the final answer in the required form.
Common Mistakes to Avoid:
- Confusing distance-time graphs with speed-time graphs
- Forgetting to check and convert units
- Misreading the scale on either axis
- Assuming all curved lines represent the same type of motion
Key Points to Remember:
- Gradient = Speed: The steepness of the line tells you how fast something is moving
- Steeper = Faster: The steeper the line, the higher the speed
- Flat = Stopped: Horizontal sections mean no movement is occurring
- Always check units: Make sure your speed calculations use consistent units
- Practice regularly: Distance-time graphs become much easier with repetition and experience
- Use the formula: is your best friend