London’s Booming Population (OCR GCSE Geography B (Geography for Enquiring Minds)): Revision Notes
London's Booming Population
Overview of London's population
London is the UK's largest city and has experienced significant population changes throughout its history. Understanding how London's population has grown and changed helps us see how the UK as a whole is developing in the 21st century. The city's population dynamics are shaped by both natural change and migration patterns, creating a diverse and growing urban centre.
London's population story is crucial for understanding broader UK demographic trends. As the nation's capital and economic hub, changes in London often reflect or predict patterns across the entire country.
Historical population growth trends
London's population has grown dramatically since the early 19th century. In 1801, the city was home to approximately 1 million people. Over the next two centuries, this figure increased steadily, rising to around 8.6 million by the start of the Second World War.
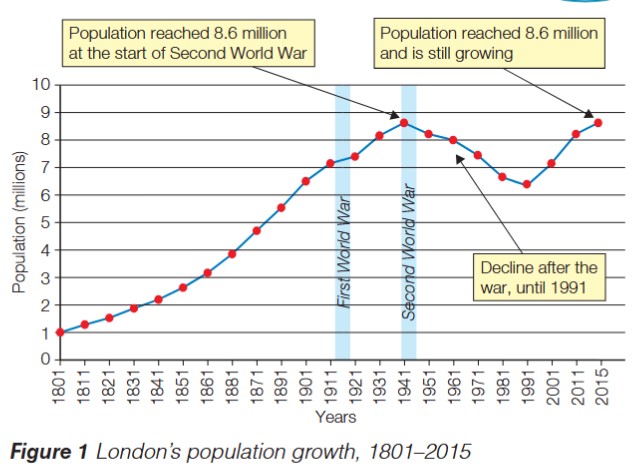
However, this growth was not continuous. Both World Wars had significant impacts on London's population. The graph shows clear disruptions during the First World War (1914-1918) and Second World War (1939-1945) periods. Following the Second World War, London experienced a sustained population decline that continued until 1991. This post-war decrease was caused by factors including bomb damage, slum clearance, and the development of new towns outside London as people moved away from the city centre.
Post-War Population Decline
The period from 1945 to 1991 saw London's population fall significantly. This wasn't just due to war damage - deliberate planning policies encouraged people to move to new towns outside the city. Understanding this decline is essential for appreciating how remarkable the recent population recovery has been.
Since 1991, London's population has recovered strongly. By 2015, it had returned to its wartime peak of 8.6 million and continues to grow. Current projections suggest the population will reach 10 million by 2030, making it one of Europe's largest cities.
Drivers of population growth
London's recent population boom is primarily driven by natural increase rather than net migration. Natural increase occurs when the birth rate exceeds the death rate in a population.
Understanding Natural Increase
Natural increase is calculated by subtracting deaths from births:
Natural Increase = Number of Births - Number of Deaths
If London has 120,000 births and 60,000 deaths in a year, the natural increase is 60,000 people. This means the population grows by 60,000, even without any migration.
Several factors contribute to this natural increase:
- Young population structure: A high proportion of London's residents are aged between 20 and 40 years old. This is the prime age range for having children, which leads to more births.
- High birth rate: The concentration of young adults results in a higher birth rate compared to other parts of the UK. More people in their childbearing years means more babies being born.
- Migration patterns: While many immigrants do arrive in London for work opportunities, people also leave the city. This means that net migration (the difference between immigration and emigration) is relatively low. The population grows more from births than from people moving in.
The London Paradox
While London attracts many new arrivals seeking employment opportunities, it also sees significant numbers of people leaving - often families moving out to surrounding areas for more space and better schools. This two-way flow means migration's impact on population growth is smaller than many people assume.
This demographic pattern is closely linked to London's role as an economic hub. People come to the city for employment, particularly in their 20s and 30s, and many start families while living there.
London's ethnic diversity
London stands out as the most ethnically diverse city in the United Kingdom. The composition of its population reflects the city's role as a global centre and its historical connections to the Commonwealth.
Understanding ethnic majority
A significant characteristic of modern London is that the majority of its population are not white British. This makes London unusual compared to other UK cities, where white British residents typically form the majority. The term ethnic diversity refers to the presence of multiple ethnic groups within a population, each bringing different cultural backgrounds and heritage.
Breakdown of ethnic groups
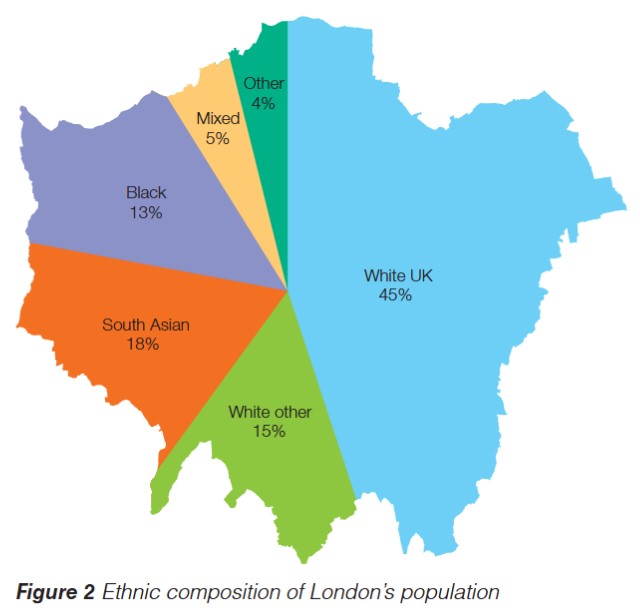
London's population in 2015 was composed of:
| Ethnic Group | Percentage of Population |
|---|---|
| White UK | 45% |
| South Asian | 18% |
| White other | 15% |
| Black | 13% |
| Mixed | 5% |
| Other | 4% |
These figures show that white British residents make up less than half of London's population, with the remaining 55% coming from diverse ethnic backgrounds.
A City of Minorities
London is unique among major UK cities in having no single ethnic majority group. The 45% white British figure means that for the first time in its modern history, London's traditional ethnic group represents less than half the population. This diversity creates a truly multicultural urban environment.
International origins
In 2011, 38% of London's population was born abroad. These residents have come from many different countries, particularly from:
- Commonwealth countries: Nations that were formerly part of the British Empire, including India, Pakistan, Bangladesh, Nigeria, Jamaica, and many others. Historical connections have encouraged migration from these countries.
- European countries: Particularly from European Union member states, where free movement policies have allowed easier migration to the UK for work and study.
This diversity is reflected throughout London's boroughs, though some areas have higher concentrations of particular ethnic groups than others. The map shows how different communities are distributed across the city's geography.
Exam focus: key command words
Understanding Exam Command Words
Success in geography exams depends on responding correctly to command words. Here's what examiners expect:
-
Describe: State what the data or map shows. For example, "London's population has grown from 1 million in 1801 to 8.6 million in 2015, with temporary declines during the World Wars."
-
Explain: Give reasons why something happens. For example, "London's population is growing mainly due to natural increase because many residents are aged 20-40, leading to a high birth rate."
-
Assess/Evaluate: Consider the importance or significance. For example, "London's ethnic diversity creates both opportunities (multicultural workforce, diverse businesses) and challenges (integration, service provision for different communities)."
Key Points to Remember:
-
London's population reached 8.6 million in 2015 and is projected to hit 10 million by 2030, marking sustained growth after post-war decline.
-
Natural increase (births exceeding deaths) is the main driver of population growth, caused by London's young demographic structure (many residents aged 20-40).
-
Net migration contributes less to growth than natural increase, as both immigration and emigration occur.
-
London is the UK's most ethnically diverse city, with only 45% of residents being white British and 38% of the population born abroad.
-
The city's ethnic diversity stems from immigration from Commonwealth countries and European nations, creating a multicultural population structure.