The UK’s Changing Population (OCR GCSE Geography B (Geography for Enquiring Minds)): Revision Notes
The UK's Changing Population
Introduction
The UK's population is constantly changing in both size and structure. Understanding these changes helps us predict future needs for services like healthcare, education, and housing. The key question is: how is the UK's population changing in the 21st century?
Population change affects everything from how many schools and hospitals we need, to housing demand and pension planning. By studying these patterns, governments and planners can make better decisions for the future.
UK population growth
The UK currently has approximately 65 million people, and this figure continues to increase. Population experts predict that the UK will reach around 70 million people by 2030. This growth is significant and has important implications for planning and resource allocation.
Two main factors drive population change in the UK:
Natural increase
Natural increase occurs when more people are born than die in a given period. It is calculated by finding the difference between the birth rate and the death rate. When births exceed deaths, the population grows through natural increase. In the UK, this was the dominant factor driving population growth during the 1990s.
Worked Example: Calculating Natural Increase
If a country has:
- Birth rate = 15 per 1,000 people
- Death rate = 10 per 1,000 people
Natural increase = 15 - 10 = 5 per 1,000 people
This means the population is growing through natural increase.
Net migration
Net migration refers to the difference between immigration (people moving into the country) and emigration (people leaving the country). When more people arrive than leave, net migration is positive and contributes to population growth. Between 2000 and 2010, net migration became the main driver of UK population growth, overtaking natural increase in importance.
Positive vs Negative Net Migration
- Positive net migration: More people moving in than leaving (immigration > emigration)
- Negative net migration: More people leaving than arriving (emigration > immigration)
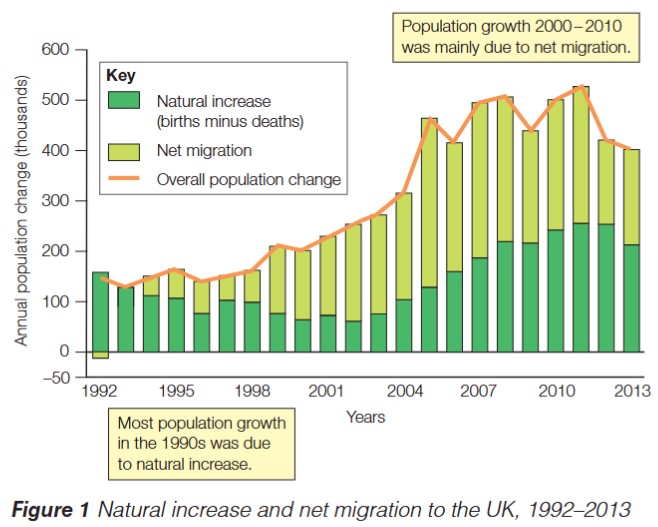
The chart above shows how these two factors have contributed to UK population change over time. Notice how the balance shifted from the 1990s, when natural increase (shown in green) was the primary factor, to the 2000s, when net migration (shown in yellow) became dominant. The orange line represents the overall population change, which is the sum of both factors.
Key Shift in Population Growth Drivers
The 1990s and 2000s represent a fundamental change in how the UK's population grew:
- 1990s: Natural increase was the main driver
- 2000s onwards: Net migration became the main driver
This shift has major implications for UK society and policy-making.
Population structure
Population structure describes how a country's population is distributed across different age groups. This distribution is crucial for understanding the demographic characteristics of a nation and planning for future needs.
The population pyramid
The most effective way to show population structure is through a population pyramid. This diagram displays the number of people in each age group, typically divided by gender, with males shown on the left and females on the right.
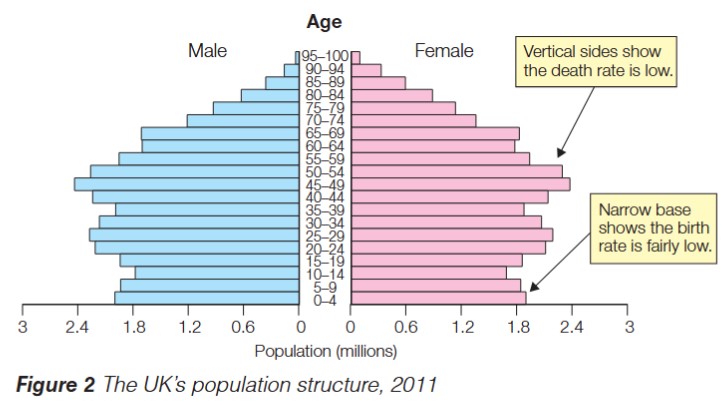
The UK's population pyramid reveals several important characteristics:
- The narrow base indicates that the birth rate is relatively low, meaning fewer young children are being born compared to previous generations
- The vertical sides show that the death rate is also low, meaning people are living longer and there is less variation in age group sizes through the working-age population
- The overall shape is more rectangular than triangular, which is typical of developed countries
What Population Pyramid Shapes Tell Us
- Narrow base: Low birth rate - fewer children being born
- Vertical sides: Low death rate - people living longer
- Rectangular shape: Typical of developed countries with slow population growth
- Triangular shape: Typical of developing countries with high birth rates
The Demographic Transition Model
The Demographic Transition Model (DTM) is a framework that describes the typical stages a country's population goes through as it develops economically. The model identifies different stages based on birth rates, death rates, and the resulting natural increase or decrease.
The UK is currently at Stage 4 of the Demographic Transition Model. This stage has the following characteristics:
- Low birth rates
- Low death rates
- Little natural change in population size
- Population growth mainly driven by migration rather than natural increase
At Stage 4, the birth and death rates in the UK are both quite low, resulting in minimal natural population change. This explains why net migration has become increasingly important for population growth in recent years.
Stage 4 Countries: Key Characteristics
Countries at Stage 4 of the DTM face particular challenges:
- Ageing population: More elderly people requiring healthcare and pensions
- Low birth rates: Fewer young workers entering the workforce
- Migration dependency: Population growth relies heavily on immigration
- Economic implications: Need to attract workers from other countries to maintain economic growth
Exam tips
Exam Success Strategies
When answering questions about population change:
- Describe questions require you to identify patterns and trends (e.g., "net migration increased from 2000 onwards")
- Explain questions need you to give reasons for changes (e.g., "net migration increased because the UK economy attracted workers from EU countries")
- Always use data from graphs and charts to support your points
- Remember to distinguish between natural increase and net migration – they are different processes
- Include specific figures and time periods to demonstrate detailed knowledge
- Use geographical terminology accurately
Remember!
Key Points to Remember:
- The UK's population is approximately 65 million and predicted to reach 70 million by 2030
- Natural increase (births minus deaths) and net migration (immigration minus emigration) are the two factors driving population growth
- Population growth in the 1990s was mainly due to natural increase, while 2000-2010 was dominated by net migration
- The UK's population pyramid shows a narrow base (low birth rate) and vertical sides (low death rate)
- The UK is at Stage 4 of the Demographic Transition Model, with low birth and death rates and little natural change
- Understanding population change is essential for planning future services and resources