Unequal Birmingham (OCR GCSE Geography B (Geography for Enquiring Minds)): Revision Notes
Unequal Birmingham
What is inequality in cities?
One of the major challenges facing Birmingham and other UK cities is inequality. This refers to the unequal distribution of wealth, opportunities, and resources across different areas of the city. Birmingham exhibits significant spatial inequality, with some areas experiencing high levels of deprivation (a lack of basic necessities and opportunities) whilst others are very wealthy.
The city is divided into smaller administrative areas called wards. The level of wealth and deprivation can vary dramatically from one ward to another, creating a patchwork of opportunity and disadvantage across Birmingham.
Spatial inequality means that where you live in Birmingham can dramatically affect your life chances, access to opportunities, and quality of life. This geographical dimension is crucial for understanding urban inequality.
Indicators of deprivation
Geographers and planners use multiple indicators to measure and understand patterns of wealth and deprivation in cities. These indicators are interconnected and often reinforce each other. The main indicators include:
- Unemployment rates – the percentage of people without work
- Educational achievement – levels of qualifications and exam results
- Child poverty – the proportion of children living in low-income households
- Household income – average earnings and wealth
- Housing quality – the condition and type of housing
- Access to services – availability of healthcare, shops, and facilities
- Crime rates – levels of criminal activity in an area
- Environmental quality – pollution, green space, and cleanliness
These indicators are closely linked and create reinforcing cycles. For example, areas with high unemployment often have lower household incomes, which can lead to poor housing quality and limited access to services. Understanding these connections is essential for explaining patterns of inequality.
Housing provision and inequality
House prices are a clear reflection of inequality in cities. The housing market creates and maintains spatial divisions between wealthy and deprived areas.
Wealthy households with high incomes can afford to purchase expensive properties. These families tend to move to the least deprived areas, which typically have better schools, lower crime rates, and pleasant environments. Examples of such areas in Birmingham include Sutton Four Oaks, located in the outer suburbs.
In contrast, poorer households, including unemployed families and those on low incomes, cannot afford to buy property. They are more likely to rent homes in the private or social housing sector. These families often live in more deprived areas closer to the city centre, such as Sparkbrook, where house prices and rents are lower but opportunities are more limited.
The Cycle of Spatial Inequality
This pattern creates a self-reinforcing cycle where wealth concentrates in certain areas whilst deprivation becomes entrenched in others. Wealthy areas attract more investment and better services, making them even more desirable, whilst deprived areas struggle to attract investment, perpetuating disadvantage.
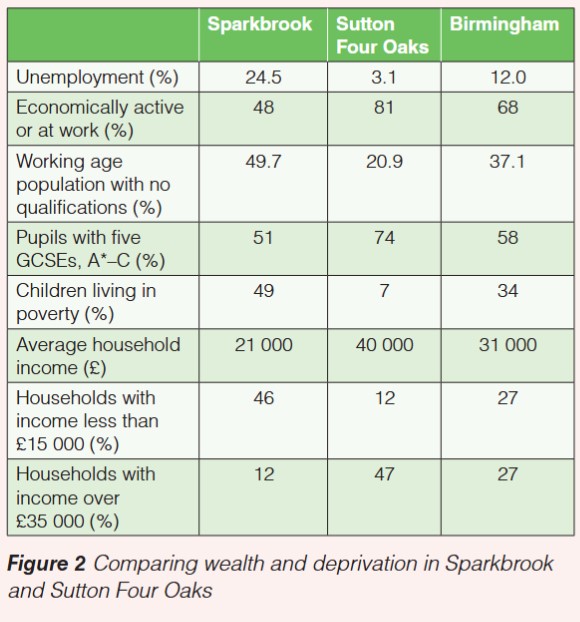
Case study: Comparing Sparkbrook and Sutton Four Oaks
Birmingham provides a stark illustration of urban inequality when we compare two contrasting wards: Sparkbrook (a deprived inner-city area) and Sutton Four Oaks (a wealthy suburban area).
Sparkbrook – A deprived inner-city ward
Sparkbrook is located close to Birmingham city centre and experiences significant deprivation across multiple indicators:
- Unemployment is extremely high at 24.5%, more than double the Birmingham average of 12.0%
- Only 48% of the working-age population is economically active or in work, compared to 68% citywide
- Educational attainment is poor, with nearly half (49.7%) of the working-age population having no qualifications
- Just 51% of pupils achieve five good GCSEs (grades A*-C), below the city average of 58%
- Child poverty is severe, with 49% of children living in poverty – this means almost half of all children in Sparkbrook live in low-income households
- Average household income is only £21,000, significantly below Birmingham's average of £31,000
- 46% of households earn less than £15,000 per year
- Only 12% of households earn over £35,000
Sparkbrook represents inner-city deprivation characterized by high unemployment, low educational attainment, and concentrated child poverty. The statistics reveal how multiple forms of disadvantage cluster together in the same geographical area.
Sutton Four Oaks – A wealthy suburban ward
Sutton Four Oaks is located in Birmingham's outer suburbs and represents one of the city's most affluent areas:
- Unemployment is very low at just 3.1%, a quarter of the city average
- 81% of the working-age population is economically active or in work, well above the citywide figure
- Educational qualifications are much higher, with only 20.9% having no qualifications
- 74% of pupils achieve five good GCSEs (grades A*-C), significantly above both Sparkbrook and the city average
- Child poverty is minimal at 7%, seven times lower than Sparkbrook
- Average household income is £40,000, nearly double that of Sparkbrook
- Only 12% of households earn less than £15,000
- 47% of households earn over £35,000 – nearly four times the proportion in Sparkbrook
Sutton Four Oaks exemplifies suburban affluence with low unemployment, high educational achievement, and minimal child poverty. The contrast with Sparkbrook demonstrates the extreme spatial inequality within Birmingham.
Key patterns
The data reveals several important patterns:
- Unemployment drives other inequalities – High unemployment in Sparkbrook (24.5%) compared to Sutton Four Oaks (3.1%) leads to lower incomes and greater deprivation
- Educational disadvantage is concentrated – Areas with high unemployment tend to have lower educational qualifications and poorer exam results
- Income inequality is extreme – The average household in Sutton Four Oaks earns nearly twice as much as in Sparkbrook
- Child poverty is spatially concentrated – Children in Sparkbrook are seven times more likely to live in poverty than those in Sutton Four Oaks
- The cycle of deprivation – Poor education leads to unemployment, which leads to low income, which perpetuates poverty
Worked Example: Calculating the Income Gap
To understand the scale of inequality, we can calculate the income difference between the two wards:
Step 1: Identify the average household incomes
- Sparkbrook: £21,000
- Sutton Four Oaks: £40,000
Step 2: Calculate the difference £40,000 - £21,000 = £19,000
Step 3: Calculate the ratio £40,000 ÷ £21,000 = 1.9 (nearly double)
This means households in Sutton Four Oaks earn, on average, £19,000 more per year than those in Sparkbrook – a difference of nearly twice as much.
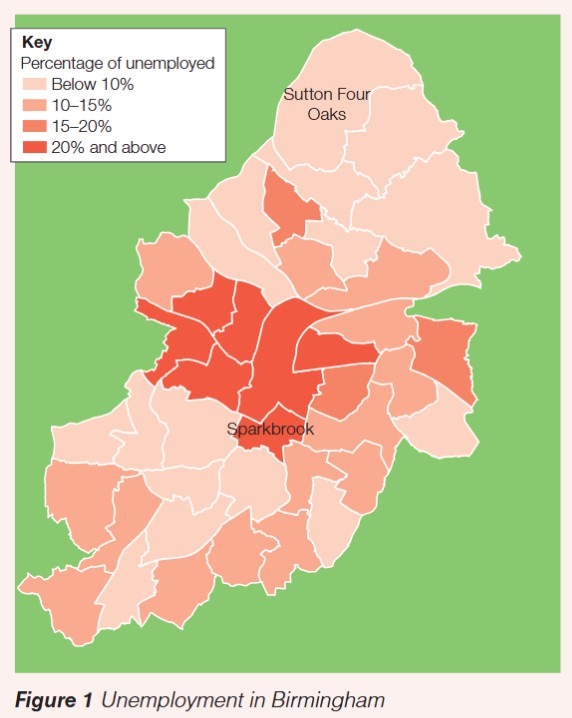
Spatial patterns of unemployment
Unemployment in Birmingham shows clear spatial patterns. Wards closer to the city centre, particularly in the inner city, tend to have much higher unemployment rates (20% and above, shown in darker red on maps). In contrast, suburban wards in the outer areas, particularly to the south and east, have much lower unemployment (below 10%, shown in lighter colours or green).
This pattern reflects how deprivation tends to be concentrated in inner-city areas, whilst wealth and opportunity are found more in suburban locations.
Complexity of Spatial Patterns
However, not all inner-city areas are deprived, and not all suburban areas are wealthy – the picture is complex. Pockets of deprivation can exist in suburban areas, and some inner-city neighbourhoods may be undergoing regeneration and improvement.
Exam guidance
When describing patterns of inequality:
- Use specific data and place examples (e.g., "Sparkbrook has unemployment of 24.5%")
- Identify trends and comparisons (e.g., "nearly double the city average")
- Refer to spatial patterns (e.g., "inner-city areas versus outer suburbs")
When explaining inequality:
- Link different indicators together (e.g., unemployment → low income → child poverty)
- Explain causes and consequences
- Consider how inequality is reinforced over time (cycles of deprivation)
When evaluating responses to inequality:
- Consider which areas need support most urgently
- Think about the interconnected nature of deprivation
- Assess whether interventions address causes or just symptoms
Remember!
Key Points to Remember:
-
Inequality is a major challenge for Birmingham, with significant variations in wealth and deprivation between different wards across the city
-
Multiple indicators measure deprivation including unemployment, educational achievement, child poverty, household income, housing quality, access to services, crime rates, and environmental quality
-
Inner-city areas like Sparkbrook experience high levels of deprivation, with unemployment at 24.5%, low average incomes (£21,000), and 49% of children living in poverty
-
Suburban areas like Sutton Four Oaks are much wealthier, with unemployment of just 3.1%, higher average incomes (£40,000), and only 7% child poverty
-
Housing reflects inequality as wealthy people move to affluent areas whilst poorer households are concentrated in deprived areas, creating and maintaining spatial divisions