Urban Fieldwork (OCR GCSE Geography B (Geography for Enquiring Minds)): Revision Notes
Urban Fieldwork
What is urban fieldwork?
Urban fieldwork is a practical geographical investigation where you collect and analyse data about urban areas. This helps you understand real-world urban geography and develop your enquiry skills. All fieldwork enquiries must be carefully planned and structured to produce valid and reliable results.
Successful fieldwork investigations require careful planning at every stage. A well-structured approach ensures your data collection is systematic, your results are reliable, and your conclusions are well-supported by evidence.
Planning an urban fieldwork enquiry
A successful urban fieldwork investigation follows a clear structure with several key stages:
Stage 1: Develop your question or hypothesis Begin by creating a clear research question or forming a testable hypothesis. This gives your investigation focus and direction. For example, "Does environmental quality decrease as distance from the CBD increases?"
Stage 2: Select appropriate fieldwork methods Choose the most suitable techniques to collect data that will help answer your question. Different methods work better for different types of investigation. You may need to use multiple methods to gather comprehensive evidence.
Stage 3: Process and present data Once collected, organise your data clearly using appropriate presentation methods. This includes creating maps, graphs, diagrams and tables that make patterns and trends visible.
Stage 4: Analyse and explain data Examine the data you have collected and explain what it shows. Look for patterns, trends, anomalies and relationships. Link your findings back to geographical theory and concepts.
Stage 5: Draw conclusions Use the evidence from your analysis to answer your original question or test your hypothesis. Make sure your conclusions are supported by the data you collected.
Stage 6: Reflect and evaluate Consider the strengths and limitations of your investigation. Think about how your methods could be improved and what you would do differently next time. Were there any problems with data collection? How reliable were your results?
Common Mistake to Avoid: Many students rush into data collection without proper planning. Always develop your research question first, then choose methods that specifically address that question. This ensures your fieldwork has clear purpose and direction.
Urban fieldwork methods
There are several different techniques you can use to investigate urban areas. Each method has particular strengths and is suited to different types of investigation.
Urban role play
This involves observing an area from the perspective of different types of people. For example, you might consider how the same street appears to a parent with young children, an elderly person, or a teenager. This helps you understand how different groups experience and use urban spaces.
Urban role play is particularly useful for understanding accessibility issues and how urban design impacts different user groups. Consider safety, mobility, and specific needs when adopting different perspectives.
Annotated sketch or photo
Create a detailed sketch of an urban area or take a photograph, then add labels and annotations to identify key features. This method is excellent for recording the visual character of a place and noting specific geographical features.
Environmental quality survey
This systematic method involves assessing different aspects of the urban environment and giving each one a score. You evaluate features using a scoring scale to measure environmental quality objectively.
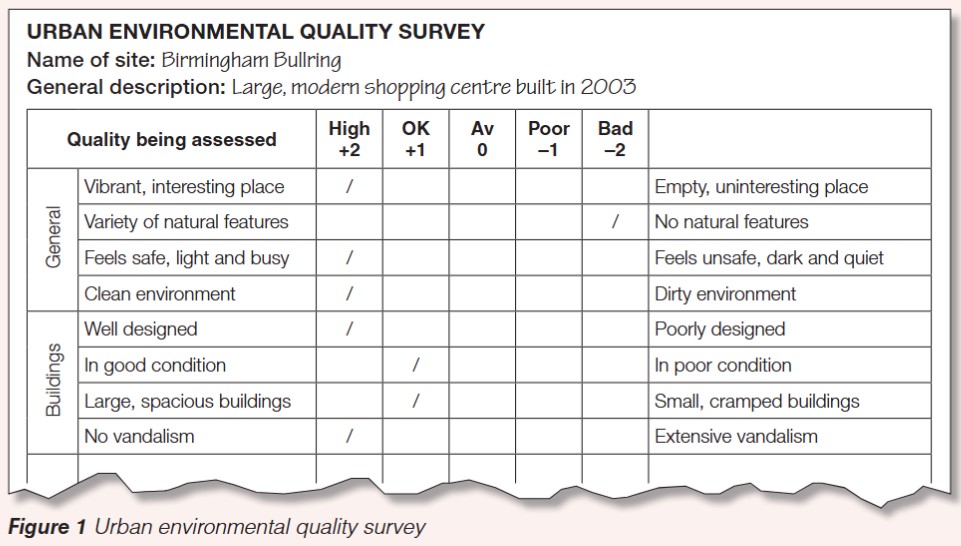
The environmental quality survey uses a bipolar scale, typically ranging from +2 to -2. You assess multiple characteristics such as:
- General features: Is the place vibrant and interesting or empty and uninteresting? Are there natural features present? Does it feel safe and busy or unsafe and quiet? Is the environment clean or dirty?
- Building characteristics: Are buildings well designed or poorly designed? Are they in good condition or poor condition? Are buildings spacious or cramped? Is there vandalism present?
For each characteristic, you place a mark on the scale that best represents what you observe. The overall score gives you a measure of environmental quality which can be compared between different locations.
Worked Example: Using an Environmental Quality Survey
Location: Town centre shopping street
Assessment process:
- General atmosphere: Vibrant and busy (+2)
- Natural features: Few trees present (+1)
- Safety: Well-lit and populated (+2)
- Cleanliness: Some litter visible (-1)
- Building design: Modern and attractive (+1)
- Building condition: Well-maintained (+2)
Total score: +7 out of 12 possible points
This positive overall score indicates good environmental quality, though improvements could be made in cleanliness and green space provision.
Exam Tip: When describing an environmental quality survey in an exam, explain how the bipolar scale works and give specific examples of the criteria being assessed. For analysis questions, identify patterns in the scores and explain what they reveal about the area.
Questionnaire
A questionnaire involves asking people about their experiences, opinions and behaviours related to the urban area. This primary data collection method provides valuable qualitative information about how people perceive and use urban spaces. Questions should be carefully designed to avoid bias and gather useful information.
When designing questionnaires, use a mix of closed questions (for easy quantitative analysis) and open questions (for detailed qualitative responses). Always pilot test your questions with a small group first to identify any confusing wording or leading questions.
Traffic and pedestrian survey
This involves counting the number of vehicles or pedestrians passing a specific point over a set time period. Traffic counts help you understand patterns of movement and can show how busy different areas are at different times. Results are often presented as flow maps or line graphs showing changes over time.
Land-use mapping
Create an outline map showing how different areas are being used, such as residential, commercial, industrial or recreational purposes. You can use different colours or patterns to represent different land uses. This provides a clear visual summary of urban land use patterns and can show how these change across the urban area.
Primary and secondary data
Understanding the difference between these two types of data is essential for conducting effective fieldwork.
Primary data
Primary data is information you collect yourself through direct fieldwork activities. Examples include:
- Survey results you personally record
- Sketches you draw in the field
- Photographs you take
- Maps you create
- Questionnaire responses you gather
- Traffic counts you conduct
The key advantage of primary data is that you can collect exactly the information you need for your specific investigation. However, it can be time-consuming to gather and may be limited to a small sample size.
Secondary data
Secondary data is information that already exists, collected by someone else for another purpose. You obtain this from sources such as:
- Internet websites
- Newspapers and magazines
- Books and journals
- Census data
- Government statistics
- Historical maps and photographs
Secondary data is often quicker to obtain and may cover larger areas or longer time periods than you could investigate yourself. However, it may not be exactly what you need, and you must check that it is reliable and up-to-date.
Critical Consideration: Always evaluate the reliability and accuracy of secondary data sources. Check when the data was collected, who collected it, and for what purpose. Official sources like census data are generally more reliable than informal websites or blogs.
Exam Tip: In exam questions about data types, clearly distinguish between primary (collected by you) and secondary (collected by others). Explain why you might use both types together in an investigation.
Investigating urban change
Urban change is an important topic for fieldwork investigation. You can explore various questions about how urban areas are changing over time.
Example questions and hypotheses
Questions you might investigate include:
- "How is the population of the urban area changing?"
- "Why is land use in the urban area changing?"
- "How is the urban area becoming more sustainable?"
You could also form hypotheses such as:
- "The proportion of ethnic minorities in the urban area is increasing"
- "Land use in the urban area is changing because more housing is needed"
- "Transport improvements are making the urban area more sustainable"
When forming hypotheses, make sure they are testable with the data you can realistically collect. A good hypothesis makes a specific prediction that can be supported or refuted by evidence.
Collecting data about urban change
To investigate urban change effectively, you need to combine both primary and secondary data.
Primary data collection: Current population data can be collected through fieldwork surveys. One method involves using a tally system to record the ethnicity of people passing by a location.
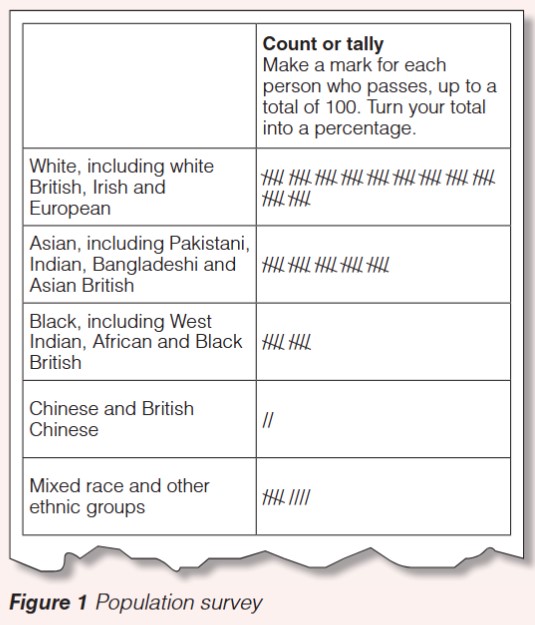
The survey method shown involves:
- Selecting a location in the urban area
- Counting people from different ethnic groups as they pass
- Using tally marks to record up to 100 people
- Converting the tallies into percentages for analysis
- Categorising people into groups such as White, Asian, Black, Chinese, and Mixed race
This provides current data about the population composition of the area.
Secondary data: Historical data about population comes from sources like census records. This allows you to compare current data with past data to identify changes over time.
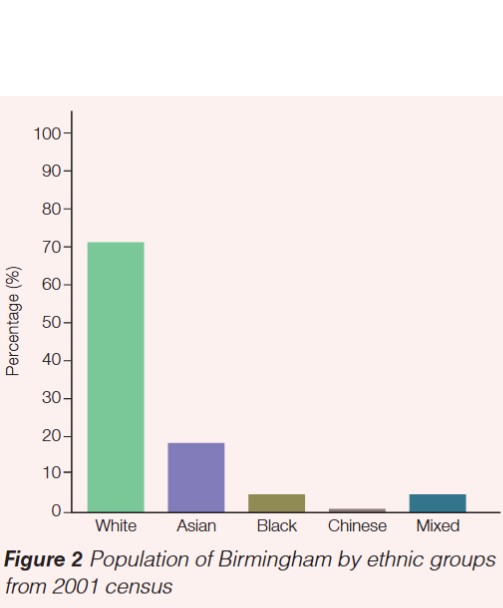
By comparing your primary data (current observations) with secondary data (historical census figures), you can identify trends and patterns in population change. For example, you might discover that the proportion of certain ethnic groups has increased or decreased over time.
Worked Example: Investigating Population Change
Research Question: Has the ethnic diversity of the high street increased since 2011?
Method:
- Conduct tally survey of 100 people on high street (primary data)
- Obtain 2011 census data for the same area (secondary data)
- Compare percentages between the two datasets
Results:
- 2011 Census: 65% White, 20% Asian, 10% Black, 5% Other
- 2021 Survey: 55% White, 25% Asian, 12% Black, 8% Other
Conclusion: The data supports the hypothesis that ethnic diversity has increased, with growth in all minority ethnic groups and a corresponding decrease in the White population percentage.
Exam Tip: When evaluating investigations about urban change, explain why using both primary and secondary data together provides more complete evidence than using just one type. Primary data shows the current situation while secondary data provides historical context.
Exam guidance for fieldwork
When answering exam questions about urban fieldwork, you need to demonstrate clear understanding of methods and their application.
Describe questions: Provide specific details about fieldwork methods, including equipment used, sampling strategies, and data recording techniques. Don't just name the method – explain how it works.
Explain questions: Link your fieldwork methods to geographical concepts and theory. Explain why you chose particular methods and how they help answer your research question.
Evaluate questions: Discuss both strengths and limitations of methods. Consider reliability, accuracy, sample size, time constraints, and potential sources of bias or error.
Assess questions: Make judgements about the effectiveness of fieldwork approaches. Support your points with specific examples and consider alternative approaches.
Key Exam Strategy: Always relate your fieldwork answers back to the specific question being asked. Avoid writing everything you know about a method – focus on the aspects that are most relevant to what the question is asking you to discuss.
Key Points to Remember:
-
Urban fieldwork must follow a clear structure: develop a question/hypothesis, select methods, collect and process data, analyse and explain, draw conclusions, then reflect and evaluate.
-
There are six main urban fieldwork methods: urban role play, annotated sketches/photos, environmental quality surveys, questionnaires, traffic/pedestrian surveys, and land-use mapping. Choose methods appropriate to your investigation.
-
Primary data is information you collect yourself through fieldwork, while secondary data comes from existing sources like census records or the internet. Most investigations use both types.
-
Environmental quality surveys use bipolar scales (e.g., +2 to -2) to score different aspects of the urban environment objectively, allowing comparison between locations.
-
Investigating urban change requires combining current primary data (your own surveys) with historical secondary data (census figures) to identify trends and patterns over time.
-
In exams, always provide specific details, link methods to geographical theory, and evaluate both strengths and limitations of your approach.