Urban Trends in the UK (OCR GCSE Geography B (Geography for Enquiring Minds)): Revision Notes
Urban Trends in the UK
Introduction to UK urban change
During the 20th and 21st centuries, UK cities have experienced three major trends that have transformed where people live and how urban areas have developed. Understanding these patterns helps explain why more than half the world's population now lives in urban areas and what this means for cities.
The main process affecting UK cities during the 20th century was not continued urbanisation, but rather suburbanisation. This was followed by counter-urbanisation in the later decades, and then re-urbanisation from the 1980s onwards. Each of these processes had distinct causes and created different consequences for UK cities.
These three urban processes didn't happen in complete isolation - they overlapped and occurred at different times in different cities. However, understanding each process separately helps explain the complex pattern of urban change across the UK.
Suburbanisation in the 20th century
What is suburbanisation?
Suburbanisation describes the movement of people away from city centres towards newly developed residential neighborhoods on the outskirts of cities, known as suburbs. Rather than living in densely packed inner city areas, residents relocated to these peripheral zones during the 20th century.
Why did suburbanisation happen?
People chose to move to the suburbs for several important reasons:
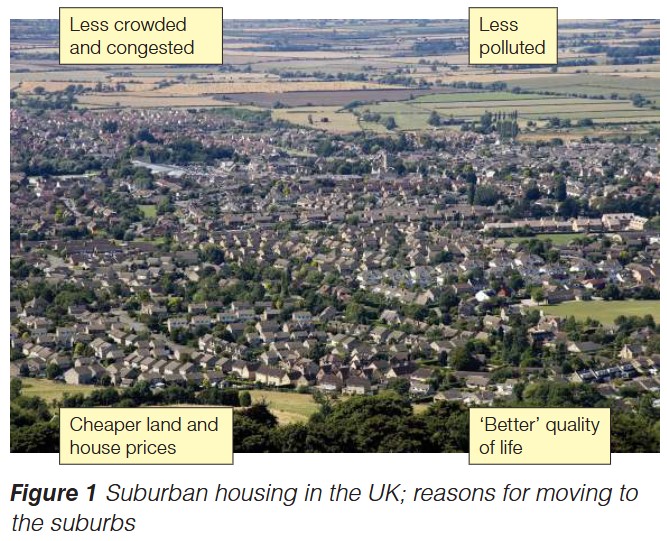
- Less crowded and congested – suburban areas offered more space and lower housing density compared to cramped city centres
- Less polluted – moving away from industrial areas and heavy traffic reduced exposure to air and noise pollution
- Cheaper land and house prices – property was more affordable on the urban fringe than in established city centres
- Better quality of life – suburbs provided access to gardens, green spaces, and a quieter living environment while still being close to city employment
Push and Pull Factors
Suburbanisation occurred because of both push factors (negative aspects driving people away from city centres, such as crowding and pollution) and pull factors (positive aspects attracting people to suburbs, such as space and affordability). Understanding both is essential for explaining this process.
Consequences of suburbanisation
The main consequence of suburbanisation was urban sprawl – the uncontrolled outward expansion of cities into the surrounding countryside. Large areas of agricultural green land were converted to housing estates, roads, and other urban development. Cities grew outwards rather than upwards, consuming more and more rural land.
There was growing concern that cities were expanding too rapidly and eating up valuable countryside. This environmental and planning problem prompted government action.
The green belt policy
In 1947, the UK government introduced the concept of a green belt to control urban sprawl. A green belt is a designated zone of protected land around cities where no further building development is permitted.
The Green Belt Policy
Green belts were designed to prevent cities from merging together and to protect valuable countryside. This policy aimed to:
- Prevent cities from merging together
- Protect countryside and agricultural land
- Maintain clear boundaries between urban and rural areas
- Encourage more compact urban development
This remains one of the UK's most significant planning policies today.
Counter-urbanisation
What is counter-urbanisation?
Counter-urbanisation represents a reversal of traditional urbanisation trends. During the second half of the 20th century, many UK cities entered a period of decline. Instead of moving to suburbs, people relocated away from urban areas entirely, choosing to live in:
- Rural countryside locations
- Small market towns
- Coastal and seaside areas
The key characteristic of counter-urbanisation is that urban populations fell as people left cities altogether.
Counter-urbanisation marked a significant shift in UK settlement patterns. For the first time in modern history, cities were losing population rather than gaining it. This created major economic and social challenges for urban areas that had been built around large populations.
Why did counter-urbanisation occur?
Several factors contributed to urban decline and counter-urbanisation:
- Deindustrialisation caused job losses in traditional manufacturing cities
- Poor environmental quality in run-down urban areas
- High crime rates and social problems in inner cities
- Improved transport links made it easier to live in rural areas while commuting to work
- Desire for a rural lifestyle and escape from urban problems
Re-urbanisation
What is re-urbanisation?
Since the 1980s, a new trend has emerged – people have been moving back into cities. Urban populations have started growing again after the period of decline. This represents a reversal of counter-urbanisation.
Why has re-urbanisation happened?
The key driver of re-urbanisation has been urban regeneration – deliberate programmes to improve and revitalize city areas. Urban regeneration helped to bring cities back to life by:
- Redeveloping derelict industrial sites and brownfield land
- Improving housing quality and creating new apartment developments
- Enhancing urban environments with better facilities and amenities
- Creating new employment opportunities in service industries
- Improving transport infrastructure and accessibility
- Making cities more attractive places to live and work
Urban Transformation
Urban regeneration transformed many declining city areas into desirable residential locations, particularly attracting young professionals and students. Cities that had been seen as undesirable in the 1970s became fashionable places to live by the 2000s, with converted warehouses and docklands becoming premium residential areas.
Evidence of population change in UK cities 2004-2013
Data from the early 21st century demonstrates that UK cities experienced varied population trends, reflecting the continuation of these different processes.
Fast-growing cities
Some cities experienced rapid population growth between 2004 and 2013:
| Rank | City | Population change | Change (%) |
|---|---|---|---|
| 1 | Milton Keynes | 36,200 | 16.5 |
| 2 | Peterborough | 24,900 | 15.2 |
| 3 | Swindon | 27,600 | 14.8 |
| 4 | Luton | 24,400 | 13.3 |
| 5 | Cambridge | 14,300 | 12.7 |
These fast-growing cities, particularly in southern England, benefited from economic growth, good transport links to London, and urban regeneration projects.
Slow-growing and declining cities
In contrast, some cities experienced minimal growth or even population decline:
| Rank | City | Population change | Change (%) |
|---|---|---|---|
| 60 | Middlesbrough | 4,300 | 0.9 |
| 61 | Grimsby | 1,300 | 0.8 |
| 62 | Burnley | 700 | 0.4 |
| 63 | Blackpool | 500 | 0.2 |
| 64 | Sunderland | -4,000 | -1.4 |
These slower-growing or declining cities, mainly in northern England, continued to face challenges from deindustrialisation and struggled to regenerate successfully.
Geographical Patterns
The data reveals a clear north-south divide in urban population change. Southern cities like Milton Keynes (+16.5%) experienced dramatic growth, while northern industrial cities like Sunderland faced decline (-1.4%). This pattern reflects broader economic and social differences across the UK, with southern cities benefiting from proximity to London and the growth of service industries.
Key Points to Remember:
-
Suburbanisation was the dominant UK urban process throughout the 20th century, causing urban sprawl and leading to the 1947 green belt policy to control outward city expansion
-
Counter-urbanisation occurred in the later 20th century when cities declined and people moved to rural areas, small towns, and coastal locations, causing urban populations to fall
-
Re-urbanisation began in the 1980s when urban regeneration projects revitalized cities, making them attractive again and causing urban populations to grow
-
These three processes occurred in sequence but overlapped – some cities were still suburbanising while others experienced counter-urbanisation, and today different cities show different trends
-
Population data from 2004-2013 shows southern cities like Milton Keynes growing rapidly (+16.5%) while northern industrial cities like Sunderland declined (-1.4%), demonstrating varied urban experiences across the UK
Memory Aid - Timeline Sequence: Think "OUT → AWAY → BACK"
- 20th century: OUT to suburbs (suburbanisation)
- Late 20th century: AWAY to countryside (counter-urbanisation)
- 1980s onwards: BACK to cities (re-urbanisation)