Supply (Junior Cert Business Studies): Revision Notes
Supply
What is supply?
Supply is an economic concept that describes the relationship between price and the quantity of goods or services that producers are willing to offer for sale. Understanding supply helps us analyse how businesses make decisions about production and pricing in response to market conditions.
Supply is the quantity of a product or service that producers are prepared to sell at various prices during a specific period.
Supply represents the seller's side of the market. When we talk about supply, we're looking at how much of a product or service businesses are willing and able to provide to consumers at different price levels.
The law of supply
The law of supply describes a predictable pattern in how producers respond to price changes.
The law of supply states that as the price of a good or service increases, the quantity supplied will also increase, all other factors remaining the same. Conversely, as the price falls, the quantity supplied falls.
This relationship exists because:
- Higher prices mean greater potential profits for producers
- When prices rise, producers are motivated to increase production
- Lower prices reduce profit margins, leading to decreased production
The phrase "all other factors remaining the same" is crucial in economics. It means we're only looking at the effect of price changes while assuming everything else (technology, costs, weather, etc.) stays constant.
Examples of the Law of Supply in Action
Example 1: If the price of beef increases significantly, Irish cattle farmers may decide to rear more cattle or convert some land from other uses to cattle farming to take advantage of the higher prices and profits.
Example 2: When smartphone cameras became very advanced, the demand for standalone digital cameras fell, causing their prices to drop. As a result, camera manufacturers reduced their supply of digital cameras because the lower prices made them less profitable to produce.
Representing supply
Supply can be shown in two main ways, both of which provide the same information but in different formats.
Supply schedules
A supply schedule is a table that shows the specific quantities of a product that producers are willing to supply at different price levels.
| Price (€) | Quantity supplied |
|---|---|
| 5 | 100 |
| 10 | 200 |
| 15 | 350 |
| 20 | 500 |
| 25 | 700 |
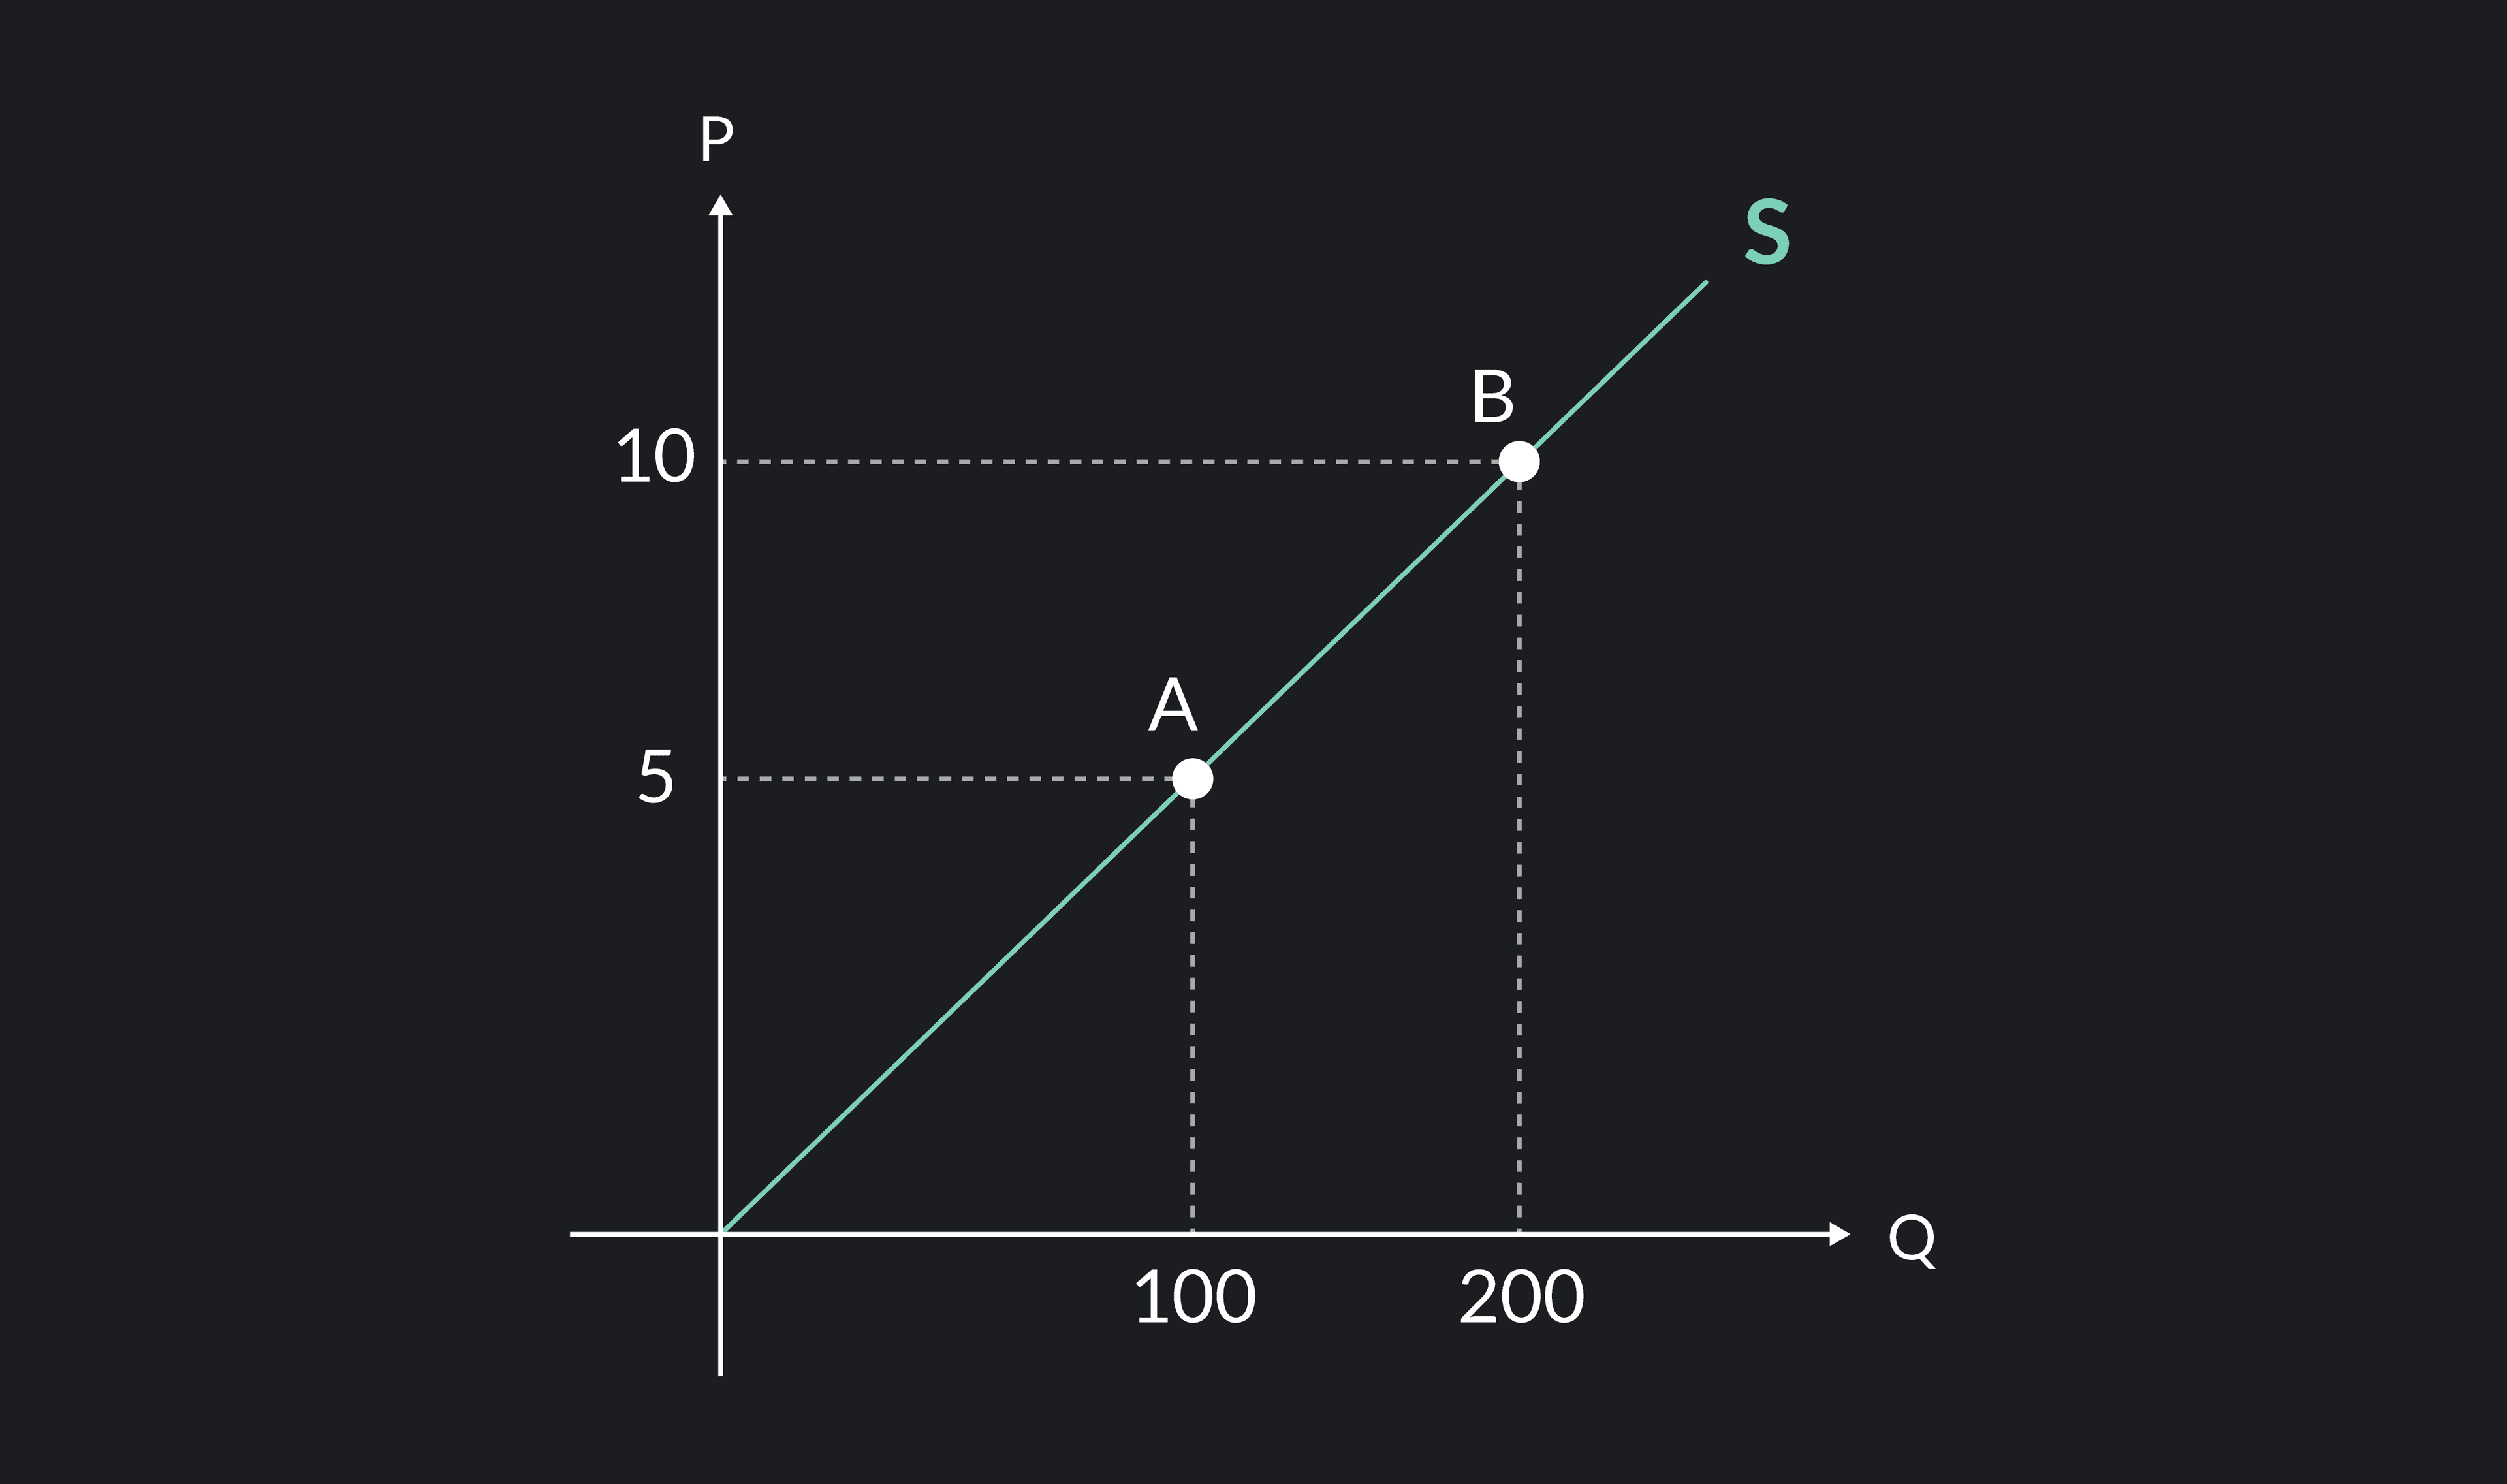
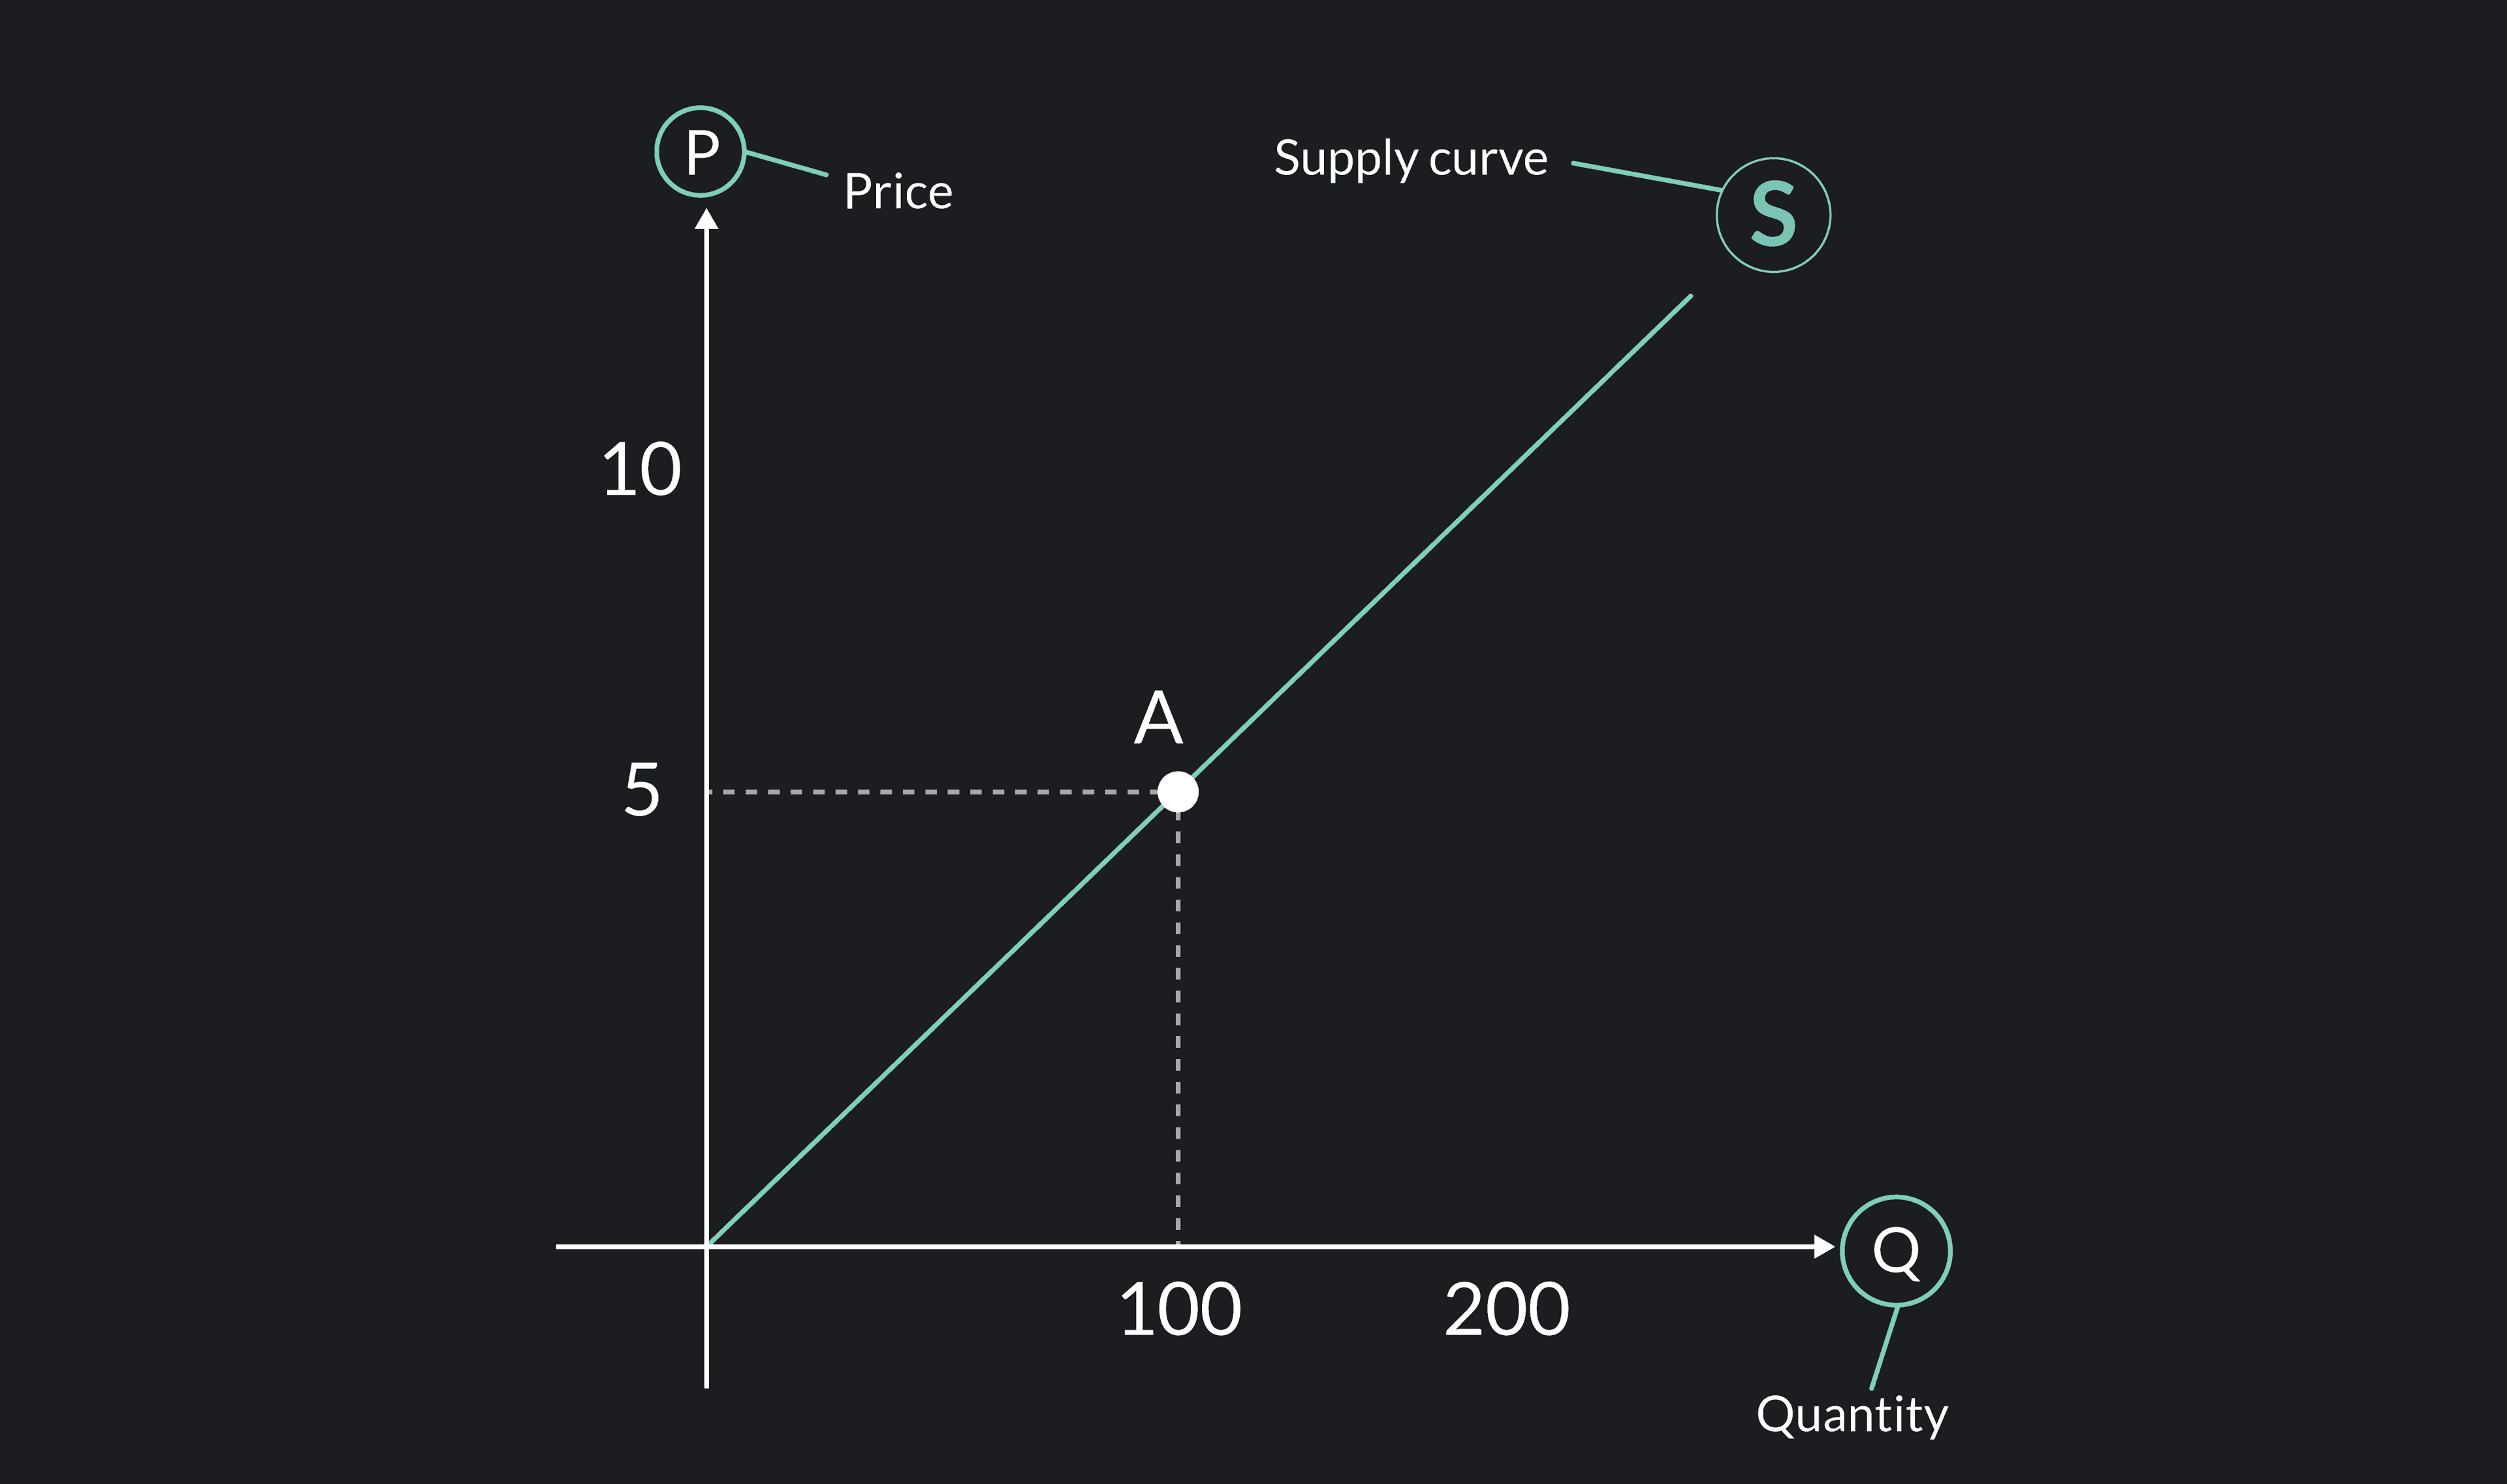
Supply curves
A supply curve is a graph that displays the same information as a supply schedule but in visual form. The supply curve typically slopes upward from left to right, showing the positive relationship between price and quantity supplied.
Key characteristics of supply curves:
- Price is shown on the vertical axis
- Quantity is shown on the horizontal axis
- The curve slopes upward (positive slope)
- Each point on the curve represents a price-quantity combination
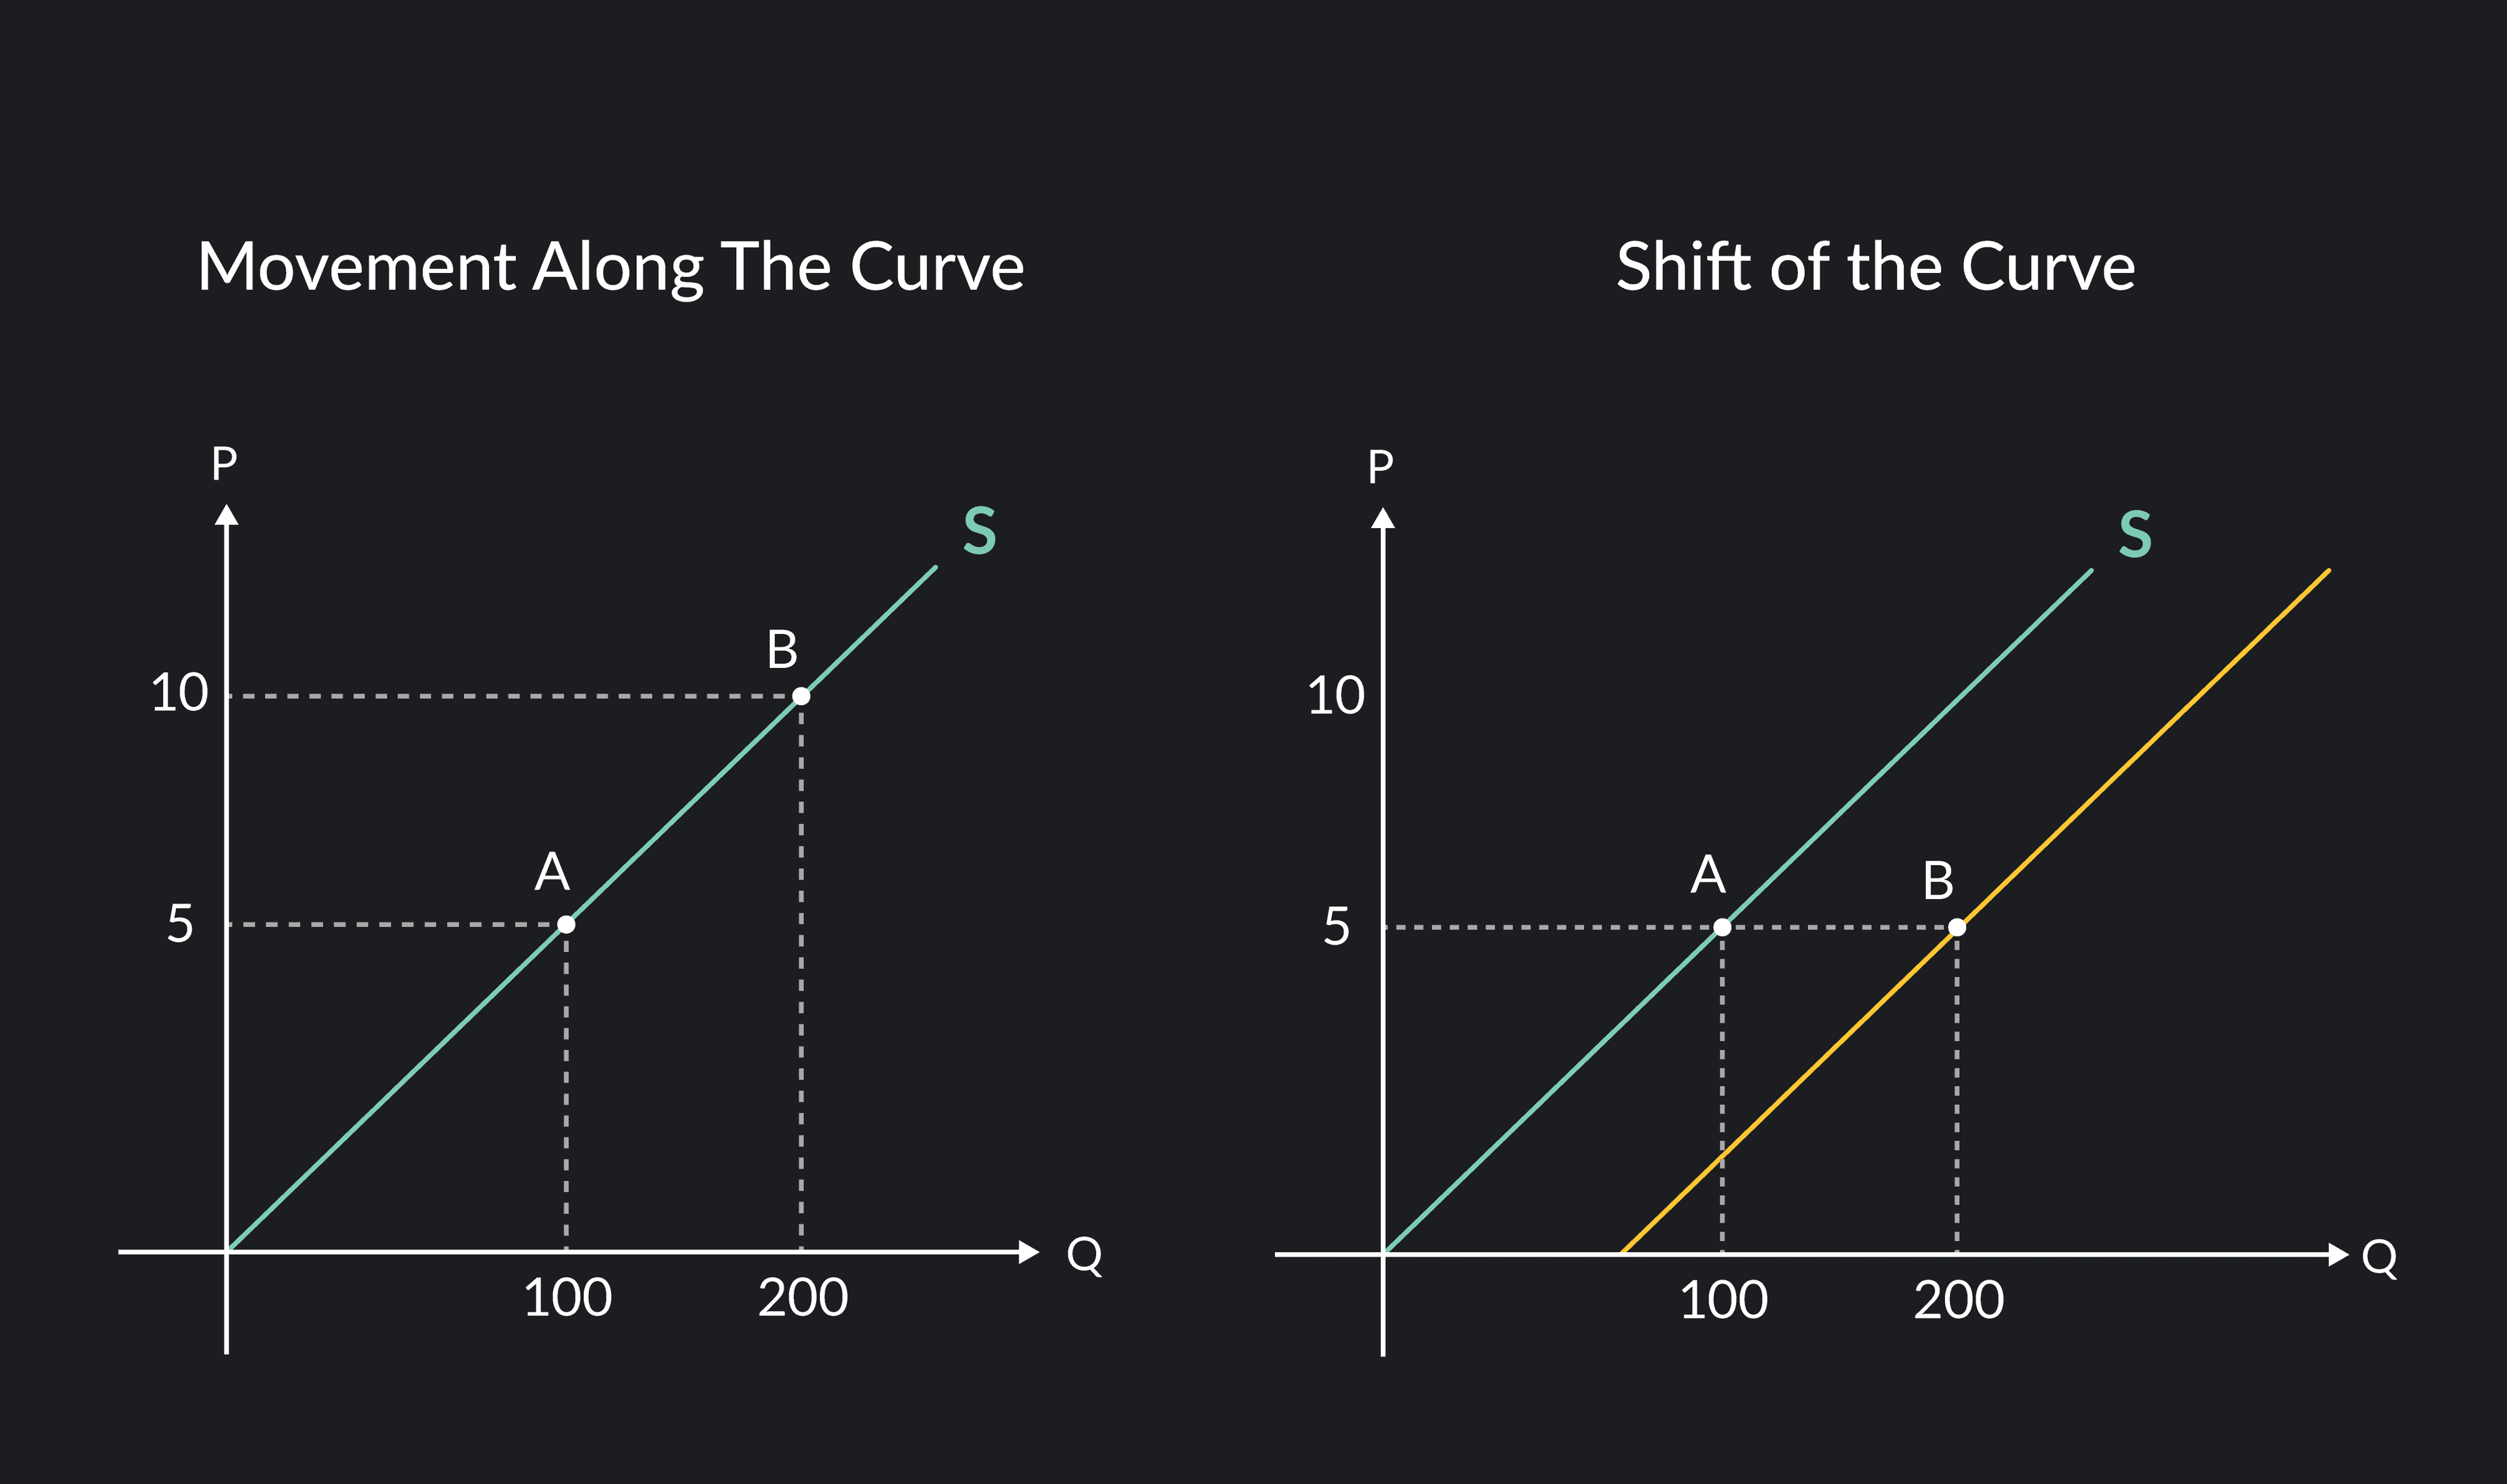
Movement along supply curves
When only the price of a product changes, we see movement along the existing supply curve. This doesn't shift the entire curve - instead, we move from one point to another on the same curve.
Movement along the curve occurs when:
- Price increases → move up and right along curve (higher quantity supplied)
- Price decreases → move down and left along curve (lower quantity supplied)
Movement Along Supply Curve Example
If Kerrygold butter's price rises from €3 to €4 per pack, Irish dairy producers will supply more butter. This represents movement along their existing supply curve, not a shift of the entire curve.
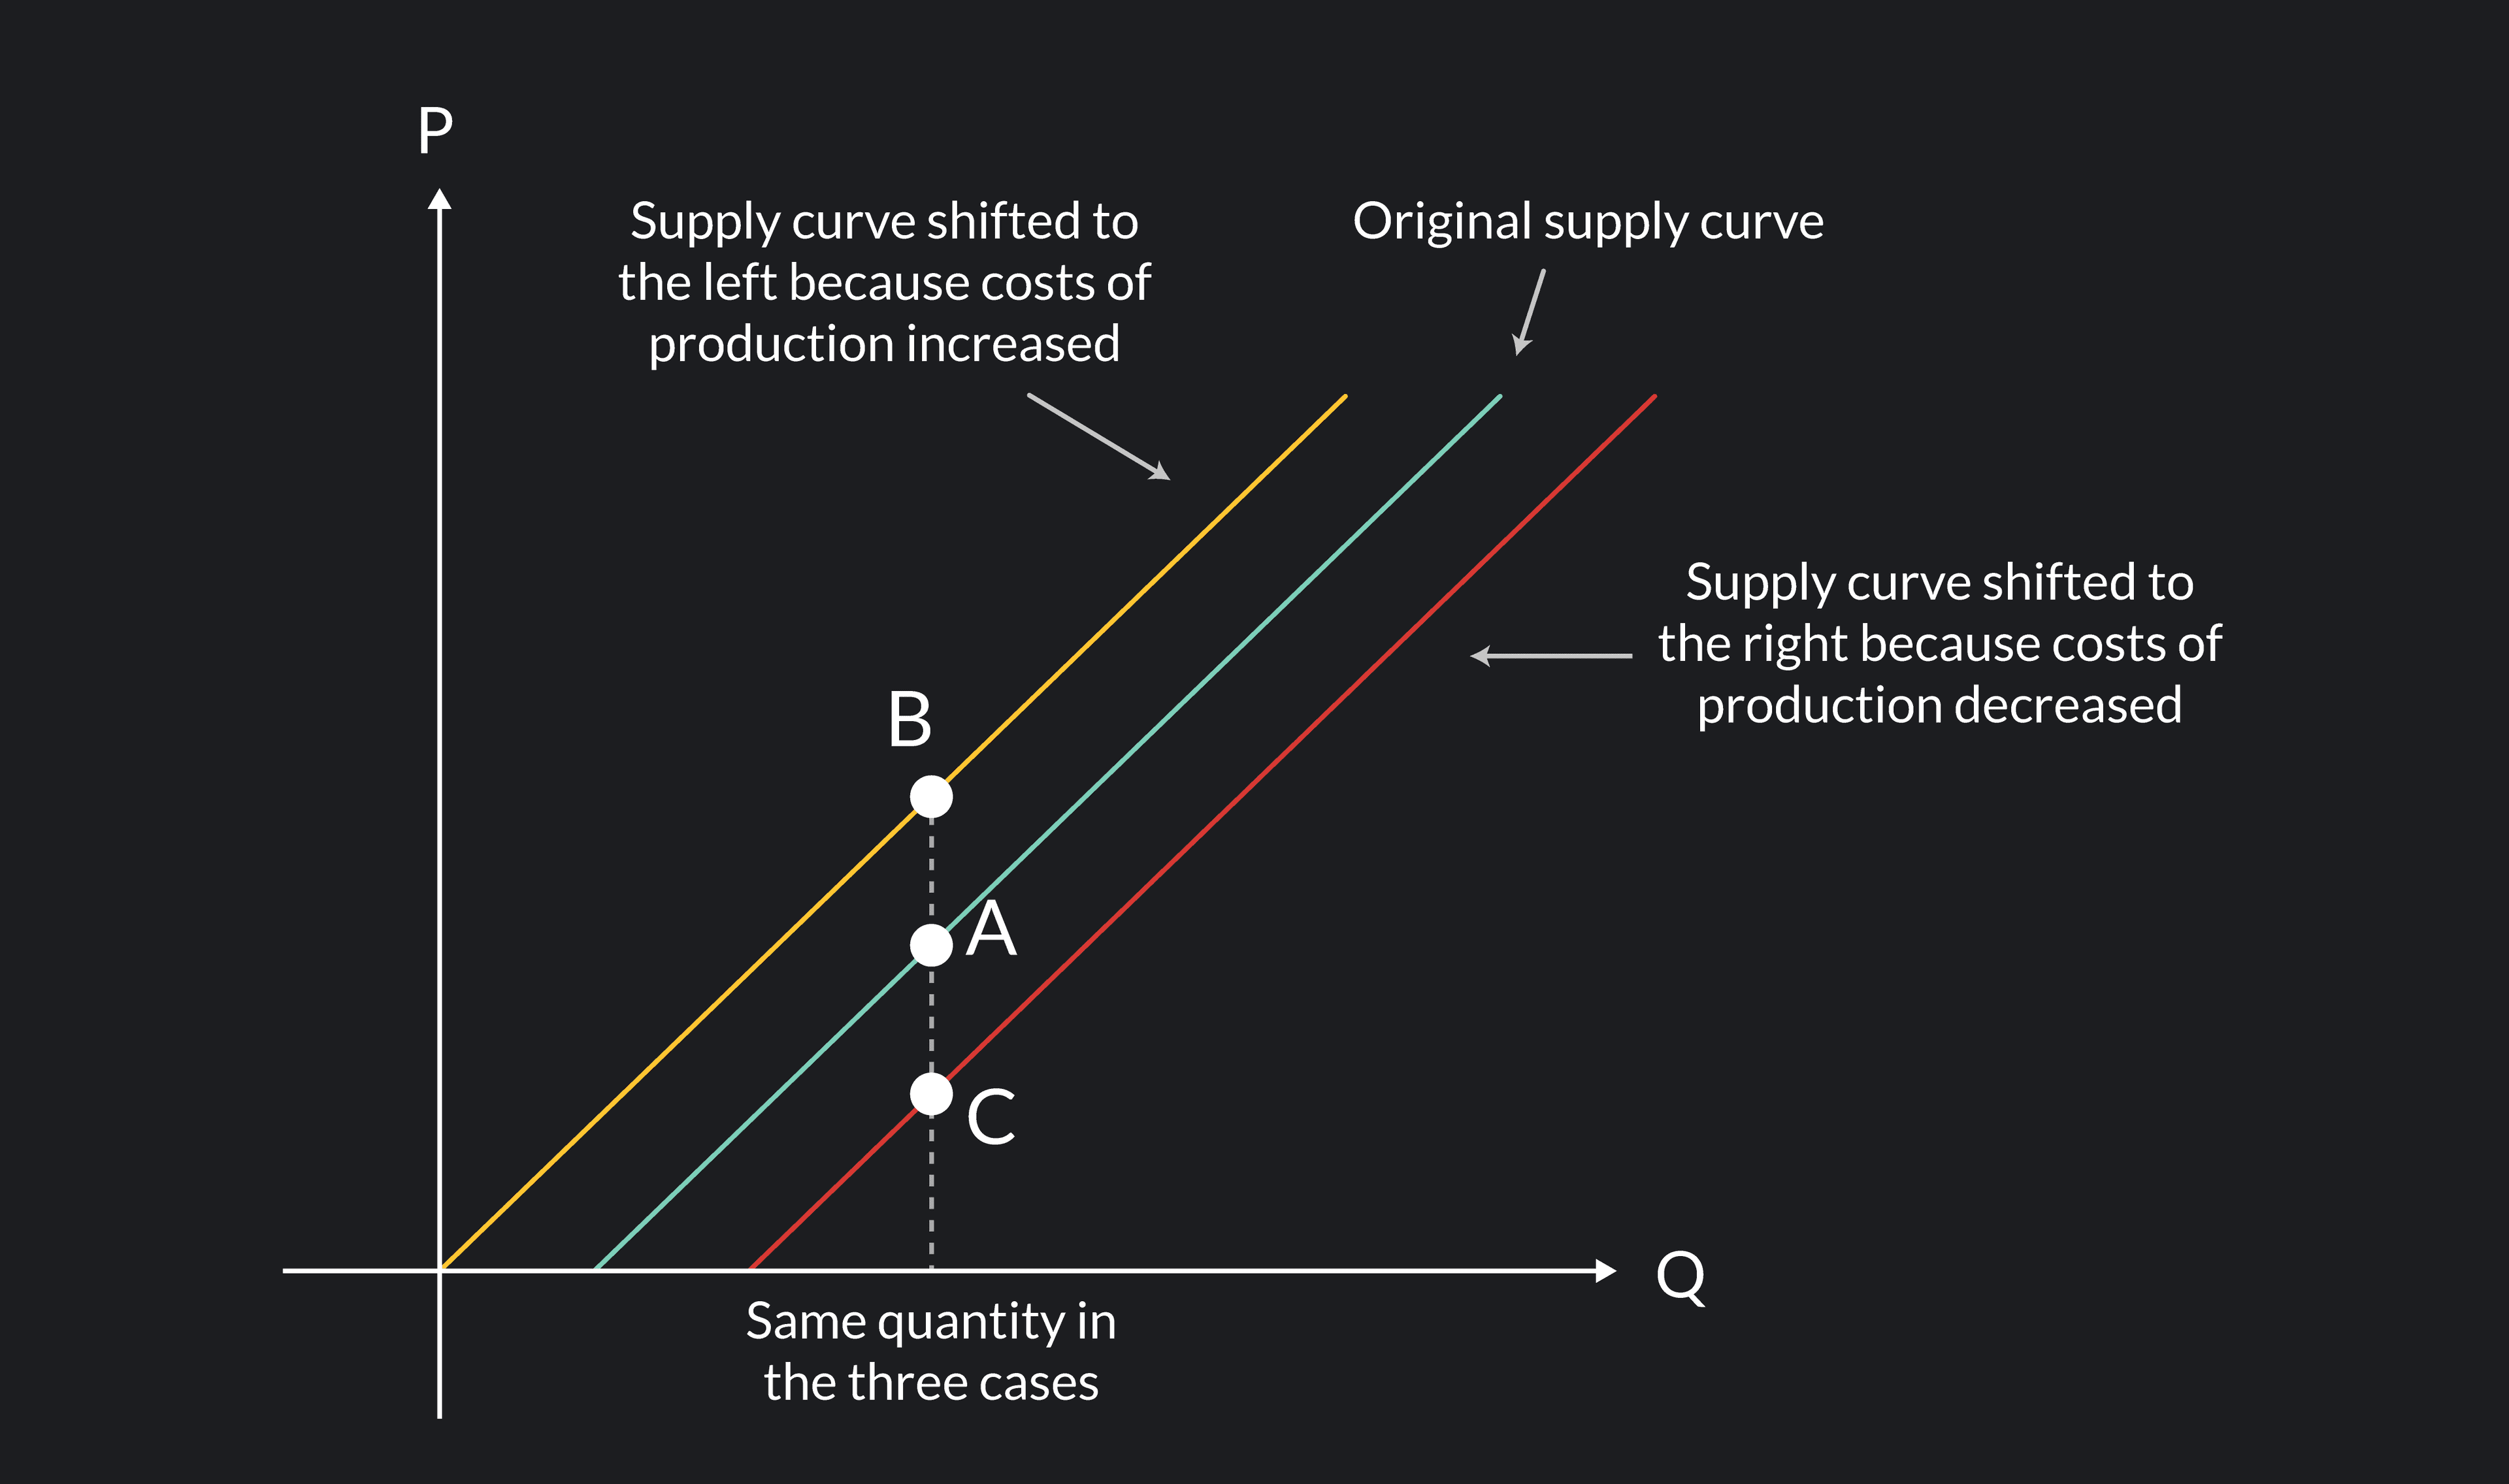
Shifts in supply curves
Sometimes factors other than price affect how much producers are willing to supply. These factors cause the entire supply curve to shift either left or right.
Understanding curve shifts
- Rightward shift (increase in supply): At any given price, producers now supply more than before
- Leftward shift (decrease in supply): At any given price, producers now supply less than before
Remember: Price changes cause movement along the curve, while non-price factors cause the entire curve to shift.
Factors that shift supply curves
Several non-price factors can cause supply curves to shift. Understanding these factors helps explain real-world changes in production and availability of goods and services.
Technology
Technological advances typically increase supply by making production more efficient and cost-effective.
How it affects supply: Better technology → lower production costs → increased supply → rightward shift
Technology Impact Example
Modern milking robots in Irish dairy farms allow farmers to milk more cows more efficiently, increasing the supply of milk and dairy products.
Costs of production
Changes in the cost of raw materials, labour, or other production inputs directly affect supply.
How it affects supply:
- Higher production costs → decreased supply → leftward shift
- Lower production costs → increased supply → rightward shift
Production Costs Example
If electricity costs increase significantly, it becomes more expensive for Irish bakeries to operate their ovens, potentially reducing the supply of bread and baked goods.
Weather conditions
Weather particularly affects agricultural supply, as crop yields depend heavily on weather patterns.
How it affects supply:
- Good weather → better crop yields → increased supply → rightward shift
- Poor weather → reduced crop yields → decreased supply → leftward shift
Weather Impact Example
Exceptionally wet summers can damage potato crops, reducing the supply of potatoes available to Irish consumers and food processors.
Number of suppliers
The number of businesses operating in a market affects total supply.
How it affects supply:
- More suppliers enter market → increased supply → rightward shift
- Suppliers leave market → decreased supply → leftward shift
Number of Suppliers Example
If more coffee shops open in Dublin city centre, the total supply of coffee services in that area increases.
Productivity
Changes in worker productivity or efficiency affect how much can be produced.
How it affects supply:
- Higher productivity → increased supply → rightward shift
- Lower productivity → decreased supply → leftward shift
Productivity Example
If Dublin Bus drivers go on strike, the productivity of public transport services falls, reducing the supply of bus transportation.
Taxes and subsidies
Government policies through taxation and subsidies can significantly impact supply.
Taxes:
- Higher taxes → increased costs → decreased supply → leftward shift
- Lower taxes → reduced costs → increased supply → rightward shift
Subsidies:
- Increased subsidies → reduced effective costs → increased supply → rightward shift
- Reduced subsidies → higher effective costs → decreased supply → leftward shift
A subsidy is an amount of money given to a business by the government or the European Union to support or encourage certain economic activities.
Government Policy Example
The government provides subsidies to Irish farmers for environmental protection measures. These subsidies help reduce farmers' costs, potentially increasing the supply of agricultural products.
Exceptions to the law of supply
While the law of supply applies to most situations, there are some notable exceptions where the normal price-supply relationship doesn't hold.
Speculative behaviour
When suppliers expect prices to rise in the future, they may withhold current supply to benefit from higher future prices.
Oil companies might reduce current supply if they expect oil prices to increase significantly next month.
Agricultural constraints
Farmers may not be able to quickly adjust supply in response to price changes due to growing seasons and biological constraints.
Irish potato farmers cannot immediately increase potato supply when prices rise, as potatoes require months to grow.
Fashion and perishable goods
Products that go out of fashion or spoil quickly may be sold at low prices to clear stock, regardless of normal supply patterns.
Clothing retailers often sell last season's fashion items at heavily discounted prices to clear inventory, even though this appears to contradict the law of supply.
Key Points to Remember:
- Supply shows the relationship between price and quantity that producers are willing to sell
- The law of supply states that higher prices generally lead to higher quantities supplied
- Supply curves slope upward and can be represented as tables or graphs
- Movement along the curve happens when price changes; shifts happen when other factors change
- Key factors affecting supply include technology, production costs, weather, number of suppliers, taxes, and subsidies