Set Theory and Probability (Junior Cert Mathematics): Revision Notes
Set Theory and Probability
In probability, we can use sets to help solve problems, especially when we have groups or categories to consider. Using sets can make it easier to organise information and calculate probabilities. Let's go through the basic ideas and see how they work with a real example.
Key Concepts:
- Set: set is just a collection of things (called elements). For example, a set might be a group of people who like Facebook.
- Union : The union of two sets means combining everything in both sets. It includes all the elements that are in either set , set , or both. You can think of this as "."
- Intersection : The intersection of two sets means only the elements that are in both sets. You can think of this as "."
- Complement (): The complement of a set is everything that is not in the set. For example, if set is people who like Facebook, ' is people who don't like Facebook. We can use Venn Diagrams to show sets in a picture. In a Venn Diagram, each set is shown as a circle. The overlapping parts of the circles show where the sets have things in common (this is the intersection).
Example: Solving a Probability Problem with Sets
Let's use an example to show how sets and a Venn Diagram can help us solve a probability problem.
Problem: 20 people were asked if they liked Facebook or Twitter. Here's what they said:
- 10 people said they liked Facebook.
- 7 people said they liked Twitter.
- 4 people said they liked neither.
- 1 person said they liked both Facebook and Twitter. Now, let's find out the probability that a randomly chosen person: i) Likes both Facebook and Twitter. ii) Likes either Facebook or Twitter (or both). iii) Likes only Facebook.
Step 1: Organise the Information First, let's break down what we know:
- There are 20 people in total.
- 10 people like Facebook, but 1 of those people also likes Twitter.
- 7 people like Twitter, but 1 of those people also likes Facebook.
- 4 people don't like either Facebook or Twitter.
Step 2: Draw a Venn Diagram To help us see what's going on, we can draw a Venn Diagram:
-
Draw two circles that overlap. One circle is for people who like Facebook, and the other is for people who like Twitter.
-
In the overlapping part (where the circles meet), write the number of people who like both Facebook and Twitter (1 person).
-
In the part of the Facebook circle that doesn't overlap, write the number of people who like only Facebook. This is 9 people (10 people like Facebook in total, but 1 of them also likes Twitter).
-
In the part of the Twitter circle that doesn't overlap, write the number of people who like only Twitter. This is 6 people (7 people like Twitter in total, but 1 of them also likes Facebook).
-
Outside the circles, write the number of people who like neither Facebook nor Twitter (4 people). Now your Venn Diagram should look like this:
-
Facebook only: 9 people
-
Twitter only: 6 people
-
Both Facebook and Twitter: 1 person
-
Neither: 4 people
Step 3: Calculate the Probabilities
Now, let's use the Venn Diagram to find the probabilities.
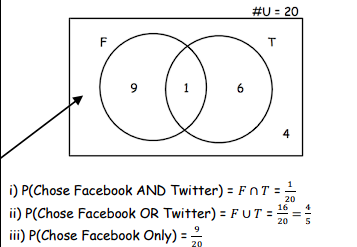
i) Probability of choosing someone who likes both Facebook and Twitter ():
-
There is 1 person who likes both Facebook and Twitter.
-
The total number of people is 20. Answer: The probability is . ii) Probability of choosing someone who likes either Facebook or Twitter :
-
People who like Facebook or Twitter (or both) are 9 (Facebook only) + 6 (Twitter only) + 1 (both) = 16 people. Answer: The probability is . iii) Probability of choosing someone who likes only Facebook:
-
People who like only Facebook are 9. Answer: The probability is .
Key Points to Remember:
- Sets help you organise information and make it easier to solve probability problems.
- Venn Diagrams are useful for showing how different groups (sets) overlap or don't overlap.
- Union includes everything in either set , set , or both. Think of it as "."
- Intersection includes only the things that are in both sets and . Think of it as " and ."
- Complement () is everything that is not in set . By understanding how sets and Venn Diagrams work, you can solve more complex probability problems with confidence. Remember to practice these skills regularly, and soon they'll become second nature!