Thermal Equilibrium Diagram (Leaving Cert Engineering): Revision Notes
Thermal Equilibrium Diagram
What is a thermal equilibrium diagram?
A thermal equilibrium diagram is a graphical representation that shows the relationship between temperature and composition for binary metal alloys. These diagrams help engineers understand how different metal combinations behave during heating and cooling processes.
The diagram displays the phases present at different temperatures and compositions, making it essential for predicting material properties and manufacturing processes.
Thermal equilibrium diagrams are also known as phase diagrams or constitutional diagrams in metallurgy. They provide a roadmap for understanding how alloys behave under different thermal conditions.
How thermal equilibrium diagrams are constructed
Thermal equilibrium diagrams are built using data from cooling curves of different metal compositions. Each cooling curve shows how temperature changes over time as a specific alloy composition cools and solidifies.
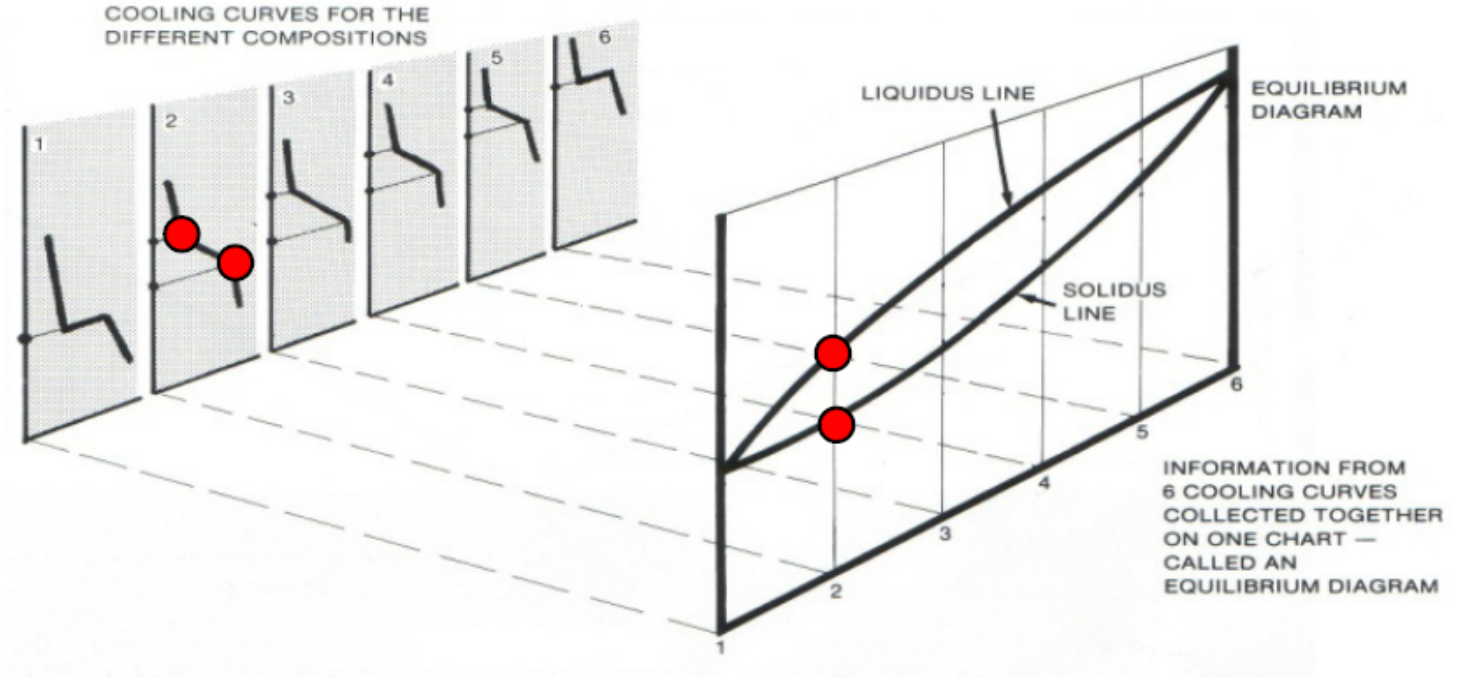
The process works as follows:
- Multiple cooling curves are created for different percentage compositions of two metals
- The start and end points of solidification are identified from each cooling curve
- These temperature points are then plotted against composition percentages
- The collected data points form the characteristic lines of the thermal equilibrium diagram
The accuracy of a thermal equilibrium diagram depends on the precision of the cooling curve data. Small variations in cooling rates or measurement errors can affect the final diagram's reliability.
Key components of thermal equilibrium diagrams
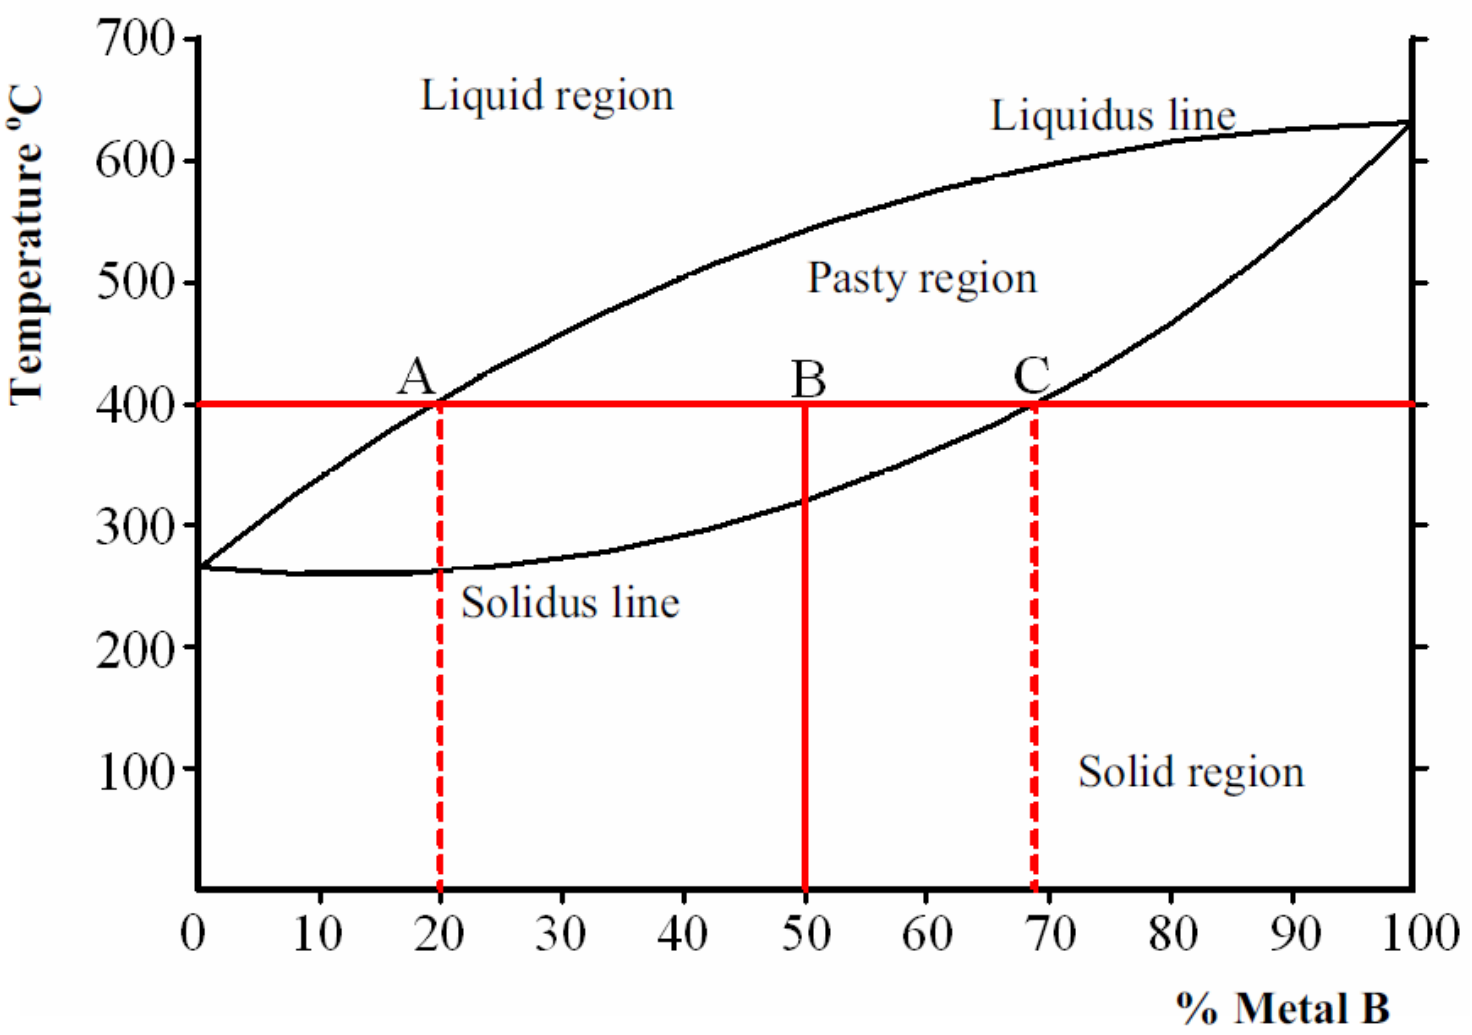
Liquidus line
The liquidus line represents the upper boundary where solidification begins. Above this line, the alloy exists completely in liquid form. This line shows the temperature at which the first solid crystals start to form during cooling.
Solidus line
The solidus line marks the lower boundary where solidification is complete. Below this line, the alloy is entirely solid. This line indicates the temperature at which the last liquid transforms to solid during cooling.
The difference between liquidus and solidus temperatures determines the solidification range of an alloy. Pure metals have the same liquidus and solidus temperatures, while alloys typically have different values.
Regions of the diagram
Liquid region: Located above the liquidus line, where both metals are completely dissolved in liquid form.
Solid region: Found below the solidus line, where both metals exist in solid solution.
Pasty region: The area between the liquidus and solidus lines, where the alloy contains both liquid and solid phases simultaneously. This mixed-phase region is crucial for understanding casting and welding processes.
Exam tips
Key Points to Remember:
- Always label the liquidus line, solidus line, and different regions clearly
- Remember that the pasty region is where both phases coexist
- Understand that cooling curves provide the experimental data for constructing these diagrams
- Be able to explain why different compositions have different solidification temperature ranges
Remember!
Essential Takeaways:
- Thermal equilibrium diagrams show the relationship between temperature, composition, and phases in binary metal alloys
- Cooling curves from different compositions provide the data to construct these diagrams
- The liquidus line marks where solidification begins, while the solidus line marks where it ends
- The pasty region between these lines contains both liquid and solid phases