Estimation of Correlation Coefficient (Leaving Cert Mathematics): Revision Notes
📚 Revision Notes
Estimation of Correlation Coefficient
Overview
The correlation coefficient is a numerical measure that describes the strength and direction of a linear relationship between two variables. It is denoted by and ranges from to :
- : Perfect positive linear relationship.
- : Perfect negative linear relationship.
- : No linear relationship. The correlation coefficient is calculated using statistical software, a calculator, or by formula. For estimation purposes, the value of can also be inferred from a scatter plot.
Steps to Estimate Correlation Coefficient
- Plot the Data: Create a scatter plot of the two variables to visually inspect their relationship.
- Examine the Trend:
- If the points form an upward-sloping line, the correlation is positive.
- If the points form a downward-sloping line, the correlation is negative.
- Determine the Strength:
- Strong correlation: Points are closely clustered around a straight line.
- Weak correlation: Points are more scattered.
- Match the Pattern to Approximate Values:
- Points tightly aligned : or higher.
- Moderate spread :
- Significant scatter : or lower.
Key Considerations
- Correlation does not imply causation.
- Outliers can significantly affect the correlation coefficient and should be considered when interpreting results.
Worked Examples
infoNote
Example 1: Strong Positive Correlation
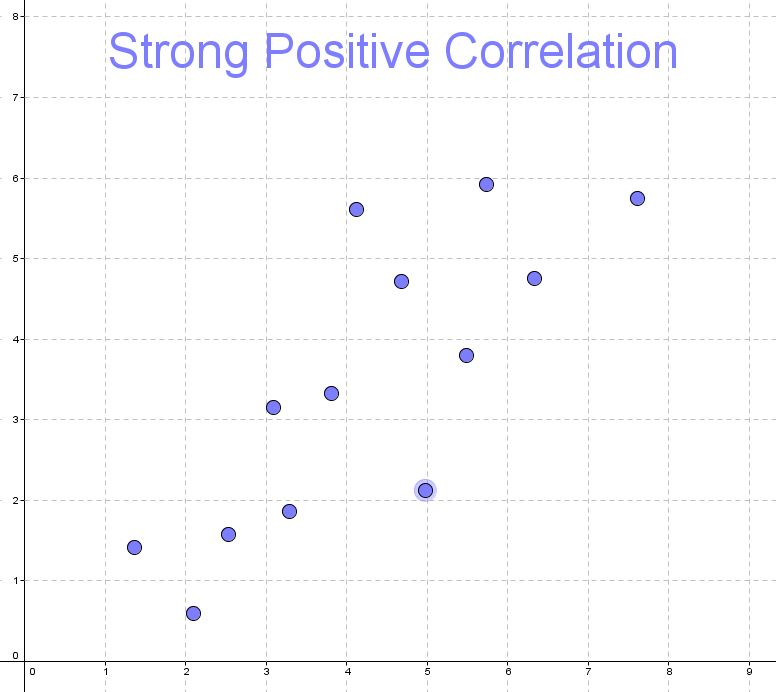
Problem:
A scatter plot shows students' study hours and their exam scores. The points form a tight upward-sloping line.
Estimate the correlation coefficient.
Solution:
- The plot shows a strong positive relationship.
- The points are tightly clustered.
- Estimate
Answer:
infoNote
Example 2: Weak Negative Correlation
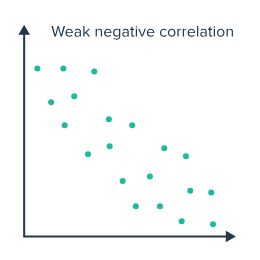
Problem:
A scatter plot shows the relationship between daily temperature and sales of hot beverages. The points are widely scattered and slope downward. Estimate the correlation coefficient.
Solution:
- The plot shows a weak negative relationship.
- The points are scattered but slope downward.
- Estimate
Answer:
Summary
- The correlation coefficient measures the strength and direction of a linear relationship between two variables.
- Range:
- : Strong positive relationship.
- : Strong negative relationship.
- : No linear relationship.
- Use scatter plots to estimate r based on the pattern and strength of the relationship.
- Key points:
- Correlation does not imply causation.
- Outliers can distort the value of