Range and Variability (Leaving Cert Mathematics): Revision Notes
Range and Variability
What is range?
The range is one of the most basic measures we use to understand how spread out our data is. It gives us a quick snapshot of the variability in a dataset.
The range tells us about the spread of our data. When you have a larger range, it means your data points are more scattered. When you have a smaller range, your data points are closer together and more consistent.
However, the range is considered a crude measure of spread because it only uses the two extreme values (the highest and lowest) and ignores all the other data points in between.
Understanding variability through examples
Let's look at how range helps us compare different sets of data and understand their consistency.
Worked Example: Comparing Student Performance
Jane's marks (out of 20): 8, 8, 14, 12, 12, 10, 14, 12, 18, 12 Conor's marks (same tests): 12, 14, 12, 16, 10, 12, 10, 12, 10, 12
For Jane:
- Mean =
- Range =
For Conor:
- Mean =
- Range =
Key insight: Although both students have the same mean (12), Conor's marks have a smaller range. This shows that Conor's results are more consistent than Jane's. Jane's marks vary more widely, showing greater variability in her performance.
This example perfectly illustrates the concept of variability - how important it can be to understand not just the average, but how spread out the data is.
Quartiles and interquartile range
When we want a more sophisticated measure of spread, we use quartiles. These divide our data into four equal parts, just like the median divides data into two halves.
When data is arranged in ascending order:
- Lower quartile (Q₁) is the value one-quarter of the way through the data
- Median (Q₂) is the value halfway through the data
- Upper quartile (Q₃) is the value three-quarters of the way through the data
The interquartile range =
This gives us a better measure of spread because it focuses on the middle 50% of our data and isn't affected by extreme values.
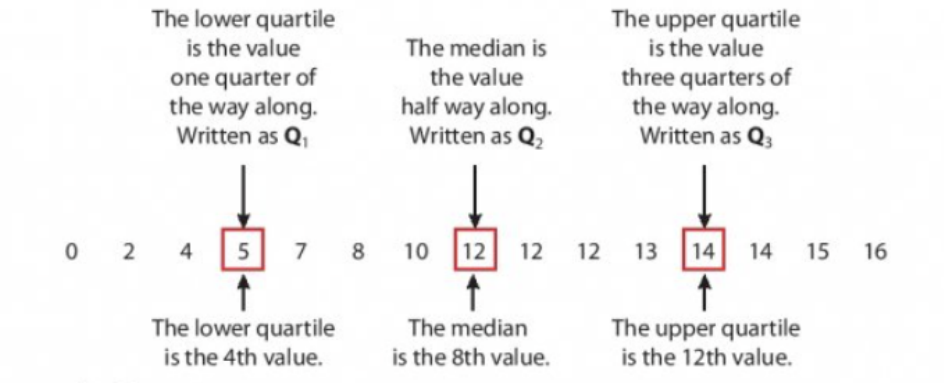
The diagram above shows how quartiles work with a dataset arranged in order. You can see , , and , giving us an interquartile range of .
Step-by-step quartile calculations
Let's work through finding quartiles with a complete example.
Worked Example: Test Marks of 11 Students
Raw data: 52, 78, 61, 49, 79, 47, 54, 58, 72, 62, 73
Step 1: Arrange in ascending order 47, 49, 52, 54, 58, 61, 62, 72, 73, 78, 79
Step 2: Find the median (Q₂) With 11 values, the middle value is the 6th position: Median = 61
Step 3: Find the lower quartile (Q₁) This is ¼ of the way through:
Step 4: Find the upper quartile (Q₃)
This is ¾ of the way through:
Step 5: Calculate interquartile range Interquartile range =
Important note: When you have an even number of values, you'll need to find the average of two middle values for the median. For example, with 10 values, the median would be the average of the 5th and 6th values.
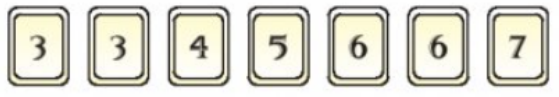
The number cards shown (3, 3, 4, 5, 6, 6, 7) represent a dataset where you can practice finding the median and quartiles.
Exam tips
- Always arrange your data in ascending order first
- Remember that range uses only the extreme values, making it a crude measure
- Quartiles give you a more reliable picture of spread
- When comparing datasets, look at both the average and the range/interquartile range
- Smaller ranges indicate more consistent data
- Show all your working clearly in exam questions
Key Points to Remember:
- Range = Highest value - Lowest value - this gives you the total spread of your data
- Range is a crude measure because it only considers the two extreme values
- Smaller range means more consistent data - this is crucial for comparing different datasets
- Quartiles divide data into quarters: (¼), (½ - the median), (¾)
- Interquartile range = - this gives you the spread of the middle 50% of your data and is more reliable than the simple range