Standard Deviation (Leaving Cert Mathematics): Revision Notes
Standard Deviation
What is standard deviation?
Standard deviation is one of the most important measures of spread in statistics. It tells us how much variation exists in a data set by measuring how far individual values are from the mean (average).
Think of standard deviation as the average distance that data points are from the mean. A small standard deviation means the data points are clustered close to the mean, while a large standard deviation means the data is spread out over a wider range.
The Greek letter σ (sigma) is used to represent standard deviation in mathematical notation. This symbol is universally recognised in statistics and mathematics.
The empirical rule
For large populations, standard deviation follows a predictable pattern called the Empirical Rule:
The Empirical Rule (68-95-99.7 Rule):
- 68% of values lie within one standard deviation of the mean (between and )
- 95% of values lie within two standard deviations of the mean
- 99.7% (almost all) values lie within three standard deviations of the mean
This rule is fundamental to understanding how data distributes around the mean in normal distributions.
Real-World Application:
If the average height of Irish men is 177 cm with a standard deviation of 8 cm, then about 68% of men have heights between 169 cm and 185 cm (177 ± 8).
Step-by-step procedure for calculating standard deviation
To find the standard deviation of a set of numbers, follow these 6 steps:
- Calculate the mean of all the numbers
- Find each deviation from the mean: for each value
- Square each deviation:
- Add up all the squared deviations:
- Divide by n (the number of values):
- Take the square root of the result
The formula is:
Worked example 1: Basic calculation
Worked Example: Finding Standard Deviation
Find the standard deviation of the numbers: 6, 9, 10, 12, 13
Step 1: Calculate the mean
Step 2: Find deviations from mean , , , ,
Step 3: Square each deviation
, , , ,
Step 4: Add the squared deviations
Step 5: Divide by n
Step 6: Take square root
Therefore, the standard deviation is 2.45.
Standard deviation from a frequency distribution
When working with frequency distributions, we modify the calculation slightly. Each squared deviation is multiplied by its frequency before adding them up.
The formula becomes:
Where:
- = frequency of each value
- = total of all frequencies
- = sum of frequency × squared deviation
Worked example 2: Frequency distribution
Worked Example: Standard Deviation from Frequency Distribution
Find the standard deviation for this frequency distribution:
| Variable (x) | 1 | 2 | 3 | 4 | 5 | 6 |
|---|---|---|---|---|---|---|
| Frequency (f) | 9 | 9 | 6 | 4 | 7 | 3 |
Step 1: Find the mean
Step 2: Create a calculation table
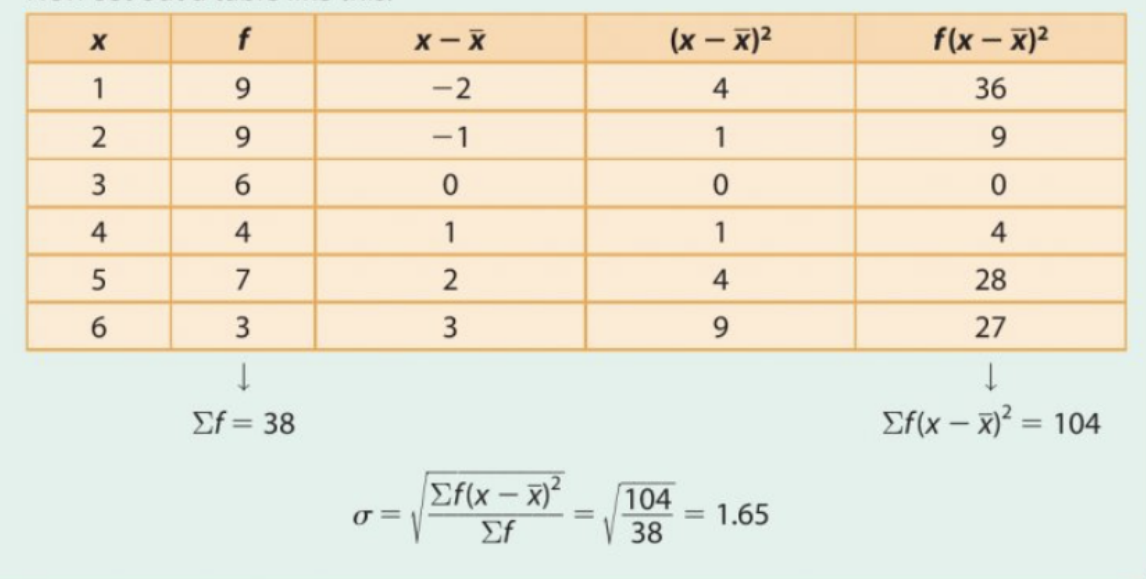
Step 3: Apply the formula
Therefore, the standard deviation is 1.65.
Using a calculator for standard deviation
Scientific calculators can significantly reduce calculation time. Here's how to use a Casio fx-83ES calculator:
For simple data sets:
- Press MODE then 2 (for statistics mode)
- Select 1 for 1-VAR
- Input your numbers using the = key after each one
- Press AC, SHIFT, 1, 5, 2, = for the mean
- Press AC, SHIFT, 1, 5, 3, = for standard deviation
For frequency distributions:
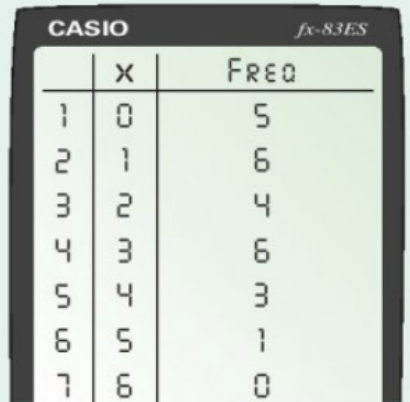
Calculator Steps for Frequency Data:
- Press MODE then 2 (statistics mode)
- Select 1 for 1-VAR
- Input each variable and its frequency
- Use the navigation keys to move between X and FREQ columns
- Press the same key sequences as above to get results
Worked example 3: Calculator method
Worked Example: Using Calculator Method
Using the calculator for the data set 5, 3, 1, 8, 2:
Key sequence:
MODE → 2 → 1 → 5 = 3 = 1 = 8 = 2 =
AC → SHIFT → 1 → 5 → 2 → = (gives mean = 3.8)
AC → SHIFT → 1 → 5 → 3 → = (gives σ = 2.5)
Worked example 4: Golf birdies
Worked Example: Real-World Application
A golfer's birdie count per round over 25 rounds:
| No. of birdies | 0 | 1 | 2 | 3 | 4 | 5 | 6 |
|---|---|---|---|---|---|---|---|
| Frequency | 5 | 6 | 4 | 6 | 3 | 1 | 0 |
Using the calculator method:
- Mean = 2.0 birdies per round
- Standard deviation = 1.5
This tells us that most rounds had between 0.5 and 3.5 birdies (within one standard deviation of the mean).
Exam tips
Essential Exam Strategies:
- Always show your working - even when using a calculator, write down the key steps
- Round appropriately - usually to 1 or 2 decimal places as specified
- Check your answer makes sense - standard deviation cannot be negative
- For grouped data, use the mid-interval values as your x-values
- Remember the empirical rule - it's often tested in exam questions
Key Points to Remember:
- Standard deviation measures spread - how scattered data is around the mean
- Small σ = data clustered together, large σ = data spread out
- The formula is for simple data
- For frequency distributions, multiply by frequencies:
- Use your calculator efficiently - learn the key sequences to save time in exams