Features Underpinning Forecasting with Regard to Business Cycles (Grade 12 NSC Matric Economics): Revision Notes
Features Underpinning Forecasting with Regard to Business Cycles
Understanding how economists predict future economic trends is crucial for making informed decisions about business, investment, and policy. There are several key features that form the foundation of economic forecasting in relation to business cycles. These features help economists analyse patterns, predict changes, and understand the overall direction of the economy.
Types of economic indicators
Leading indicators
Leading indicators act as early warning signals that help predict where the economy is headed. These indicators provide valuable insights to consumers, businesses, and government about potential future economic conditions.
When leading indicators begin to rise, we can expect that overall economic activity will follow suit within a few months. This predictive quality makes them particularly valuable for planning purposes.
Leading indicators are the most valuable type of economic indicator for planning purposes because they provide advance warning of economic changes, typically 3-6 months before the actual change occurs in the broader economy.
Key examples of leading indicators include:
- Job advertising space (more job ads suggest economic growth ahead)
- Inventory levels (businesses stock up before expected growth)
- Sales figures (increasing sales often precede broader economic expansion)
Co-incident indicators
Co-incident indicators move in harmony with the economy, changing at exactly the same time as overall economic activity. These indicators reflect the current state of the economy rather than predicting future changes.
Co-incident indicators are particularly useful for confirming what phase of the business cycle the economy is currently experiencing. They provide a real-time snapshot of economic performance.
Think of co-incident indicators as economic mirrors - they show exactly what's happening in the economy right now, without any delay or advance warning.
Common examples include:
- Value of retail sales (reflects current consumer spending)
- Real GDP (measures current economic output)
Lagging indicators
Lagging indicators are the last to change direction, only shifting after the business cycle has already moved into a new phase. While they don't help predict future changes, they confirm that a cyclical change has indeed occurred.
These indicators are valuable for verifying economic trends and ensuring that apparent changes in the economy are genuine rather than temporary fluctuations.
Lagging indicators are crucial for confirmation but should never be used for prediction. They help economists verify that economic changes are real and sustained, not just temporary fluctuations.
Examples of lagging indicators include:
- Hours worked in construction (changes after economic conditions have shifted)
- Total commercial vehicles sold (reflects economic conditions that have already established themselves)
Key features of business cycle analysis
Composite indicators
Composite indicators represent a sophisticated approach to economic analysis. They combine various indicators of the same type into a single, comprehensive value. This grouping creates a more reliable and representative measure than any individual indicator alone.
The resulting single figure becomes a benchmark for measuring a country's economic performance. By combining multiple data sources, composite indicators reduce the impact of temporary fluctuations in any one indicator.
Worked Example: Creating a Composite Leading Indicator
Step 1: Collect individual leading indicators
- Job advertisements: +5% this month
- Business inventory levels: +3% this month
- New building permits: +8% this month
Step 2: Calculate the average Composite leading indicator = (5% + 3% + 8%) ÷ 3 = 5.3% growth
This single figure of 5.3% provides a more reliable prediction than any individual indicator alone.
Trend analysis
The trend represents the general direction that the economy is taking over time. Understanding trends helps distinguish between short-term fluctuations and longer-term economic movements.
A trend line that slopes upward gradually indicates a growing economy over the long run. This rising pattern suggests sustained economic development despite temporary ups and downs along the way.
When analysing trends, always look at the long-term pattern rather than short-term fluctuations. A few months of decline doesn't necessarily indicate a negative trend if the overall long-term pattern shows growth.
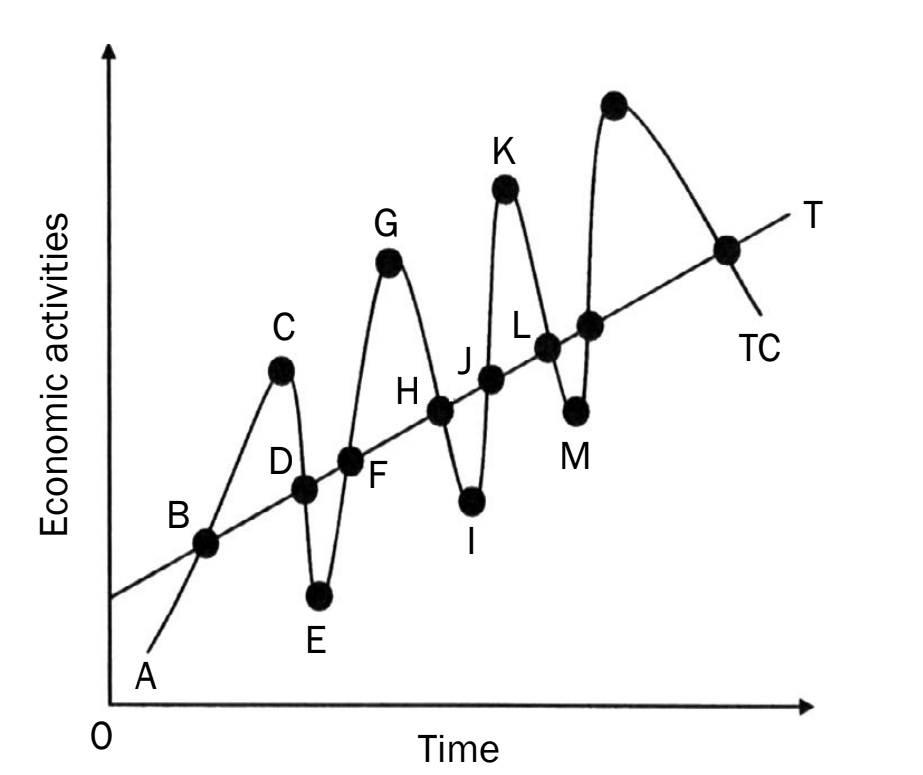
Length measurement
Length in business cycle analysis refers to the duration of economic cycles. This measurement is taken from one peak to the next peak, or from one trough to the following trough.
The length of cycles provides important information about economic strength and stability. Longer cycles typically indicate economic strength and resilience, while shorter cycles may suggest economic weakness or volatility.
Amplitude assessment
Amplitude measures the vertical difference between a trough and the following peak in a business cycle. This feature tells us about the intensity of economic fluctuations.
The larger the amplitude, the more dramatic the economic changes that occur during the cycle. High amplitude suggests significant economic volatility, while lower amplitude indicates more stable economic conditions.
Worked Example: Calculating Amplitude
Consider a business cycle where:
- Economic trough (lowest point): GDP growth of -2%
- Economic peak (highest point): GDP growth of +6%
Amplitude = Peak - Trough = 6% - (-2%) = 8%
This 8% amplitude indicates moderate economic volatility during this cycle.
Extrapolation techniques
Extrapolation involves using known facts and data to estimate unknown future conditions. This technique is fundamental to economic forecasting and prediction.
For example, economists use extrapolation to predict future share prices based on current market trends and historical data. The accuracy of extrapolation depends on the quality of available data and the stability of underlying economic conditions.
Extrapolation works best when underlying economic conditions remain stable. Major disruptions like natural disasters, wars, or pandemics can make extrapolation less reliable because they change the fundamental assumptions about future conditions.
Moving averages
Moving averages provide a method for analysing changes in data over specific periods. This technique helps smooth out short-term fluctuations to reveal underlying trends.
By calculating averages over moving time periods, economists can better understand whether apparent changes represent genuine trends or temporary variations in economic activity.
Memory aid for forecasting features
Memory Aid Rhyme
To help remember these important forecasting features, you can use this helpful rhyme:
"Leading indicators show us where we're heading
Lagging indicators won't change direction
Co-incident indicators, moving together
What's the trend? Show me the way
What's the length? Weak or strong today
Pump up the amplitude to see the difference
I need to extrapolate to make my predictions"
Singing these words to a catchy tune and repeating them regularly will help reinforce your understanding of these crucial economic concepts.
Practical application
Understanding these forecasting features helps economists and policymakers make more informed decisions. By combining information from different types of indicators and applying various analytical techniques, forecasters can develop more accurate predictions about future economic conditions.
Successful economic forecasting requires using multiple features together rather than relying on any single indicator or technique. The combination of leading, co-incident, and lagging indicators provides the most comprehensive view of economic conditions.
The business cycle graph shown demonstrates how these concepts work together in practice, with economic activities fluctuating over time in predictable patterns that can be analysed using these forecasting features.
Key Points to Remember:
- Leading indicators predict future economic changes and provide early warning signals
- Co-incident indicators move simultaneously with the economy and show current conditions
- Lagging indicators confirm changes after they have already occurred
- Trend analysis reveals the general direction of economic development over time
- Composite indicators combine multiple measures for more reliable economic assessment
- Length and amplitude measure the duration and intensity of business cycles
- Extrapolation and moving averages are essential analytical techniques for forecasting