Other Types of Titrations (HSC SSCE Chemistry): Revision Notes
Other Types of Titrations
After mastering direct titration techniques, chemists can use several alternative titration methods for more complex analyses. These specialised techniques are particularly useful when standard titration methods are not suitable.
Types of advanced titrations
There are four main types of specialised titrations:
- pH curve titrations: Using pH meters to track acid-base reactions
- Conductometric titrations: Using conductivity changes to determine end points
- Back titrations: Indirect analysis when direct titration is not possible
- Redox titrations: Based on oxidation-reduction reactions
Using pH curves (titration curves)
When pH curves are necessary
A pH meter becomes essential when the solution being analysed interferes with indicator colour changes. This occurs with:
- Dark or coloured solutions (malt vinegar, orange juice, red wine)
- Turbid (cloudy) solutions
- Solutions where the indicator colour cannot be seen clearly
In these situations, traditional indicators become unreliable because their colour changes cannot be observed against the background colour or cloudiness of the solution. A pH meter provides an objective measurement that is not affected by the solution's appearance.
How to perform a pH titration
The basic technique involves:
- Recording the initial pH of the solution in the reaction vessel
- Adding titrant in increments
- Recording the pH after each addition
- Identifying the region of rapid pH change
- Repeating with smaller increments ( or ) near the equivalence point
- Plotting pH versus volume of titrant added
- Finding the equivalence point at the midpoint of the steep section
The equivalence point is located at the midpoint of the steep (vertical) section of the pH curve, not necessarily at pH 7. The pH at equivalence depends on the strength of the acid and base used in the titration.
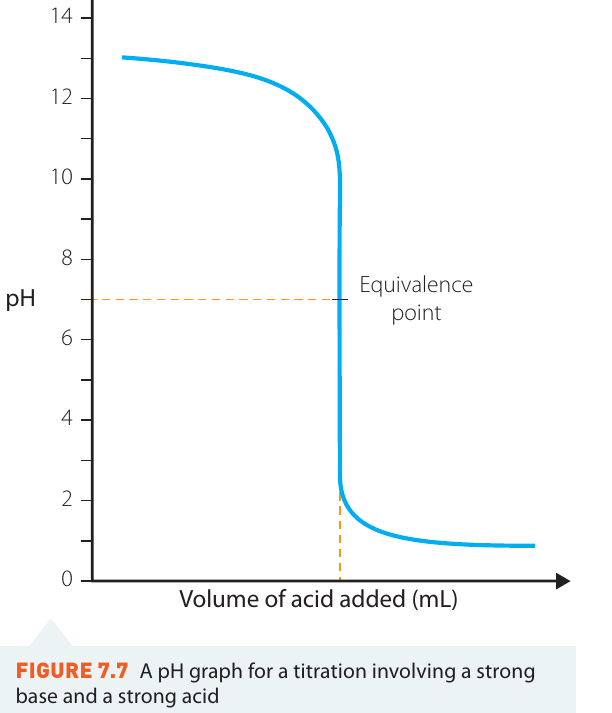
Strong base and strong acid titrations
When titrating a strong base with a strong acid, the pH curve shows distinctive features:
- Starts at very high pH (-) in the basic region
- Remains fairly constant until near equivalence point
- Suddenly drops steeply from pH - to pH -
- Stays constant at low pH when acid is in excess
- Equivalence point occurs at pH 7 (neutral)
The sharp vertical drop makes it easy to identify the equivalence point precisely.
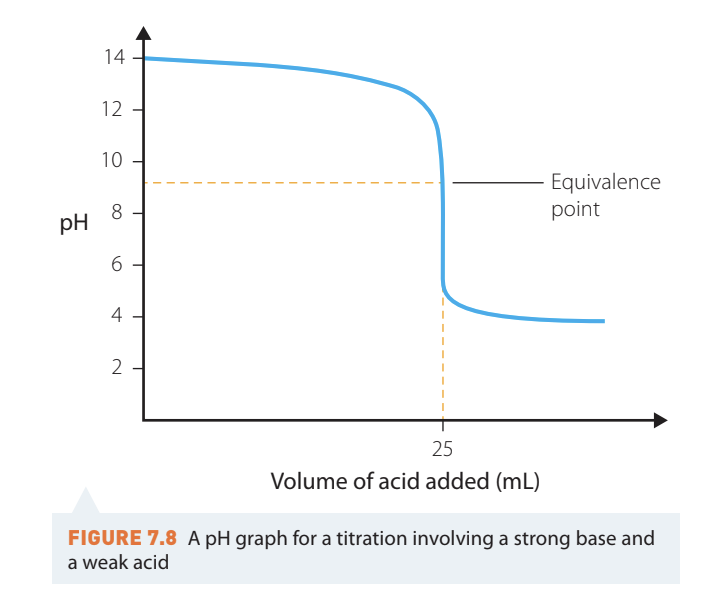
Strong base and weak acid titrations
This combination produces a different curve shape:
- Starts at very high pH (-)
- Remains fairly constant initially
- Drops suddenly but less steeply than strong-strong combination
- pH falls from - to about
- Equivalence point is greater than pH 7 (basic)
The equivalence point is basic because the salt produced is a basic salt. This is why the pH does not drop all the way to pH -. The salt undergoes hydrolysis, producing hydroxide ions that maintain the basic pH.
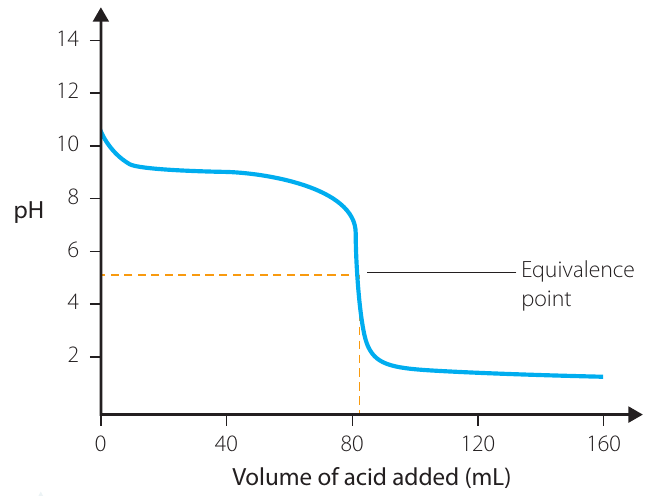
Weak base and strong acid titrations
For weak base titrations:
- Starts at moderately high pH (-), not as high as strong base
- Decreases slightly before equivalence point
- Drops suddenly from pH - to pH -
- Remains at low pH when acid is in excess
- Equivalence point is less than pH 7 (acidic)
The acidic equivalence point results from the formation of an acidic salt.
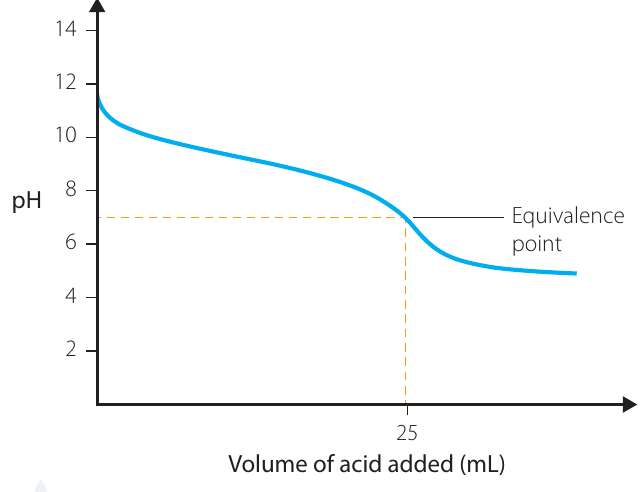
Weak base and weak acid titrations
This combination is generally not recommended:
- Starts at moderately high pH (-)
- Shows a gradual decrease throughout
- Very small pH change at equivalence point (pH - to pH -)
- Difficult to identify the equivalence point accurately
Because the pH change is so gradual, weak acid-weak base titrations are rarely performed directly. The equivalence point cannot be determined with sufficient accuracy, making this method impractical for quantitative analysis.
Using conductivity graphs
What is conductometric titration
A conductometric titration uses changes in electrical conductivity to determine the equivalence point. A conductivity probe measures how well the solution conducts electricity throughout the titration.
Advantages of conductometric titrations
This method offers several benefits:
- Works with very dilute solutions
- Suitable for trace-level analysis
- Can be used with coloured or turbid solutions
- Works for relatively incomplete reactions
- Applicable to acid-base, redox, precipitation and non-aqueous titrations
Conductometric titrations are particularly valuable when pH curves or indicators cannot be used. They provide a reliable alternative for challenging samples that would be difficult to analyse by other methods.
Factors affecting conductivity
The electrical conductivity of a solution depends on several factors:
Ion concentration: Higher concentration means greater conductivity. Solutions of strong acids and bases (which ionise completely) have higher conductivity than weak acids and bases.
Ion size: Larger ions are less mobile, so conductivity decreases as ion size increases.
Temperature: Higher temperatures increase ion mobility, increasing conductivity.
Ion replacement: During titration, one ion is replaced by another with different conductivity, causing measurable changes.
The mobility of hydrogen ions () is exceptionally high compared to other ions. This is why replacing ions with other cations causes a significant decrease in conductivity, even when the total ion concentration remains similar.
How to interpret conductivity graphs
The equivalence point is determined by plotting conductance against volume of titrant added. The shape depends on the strength of the acid and base used.
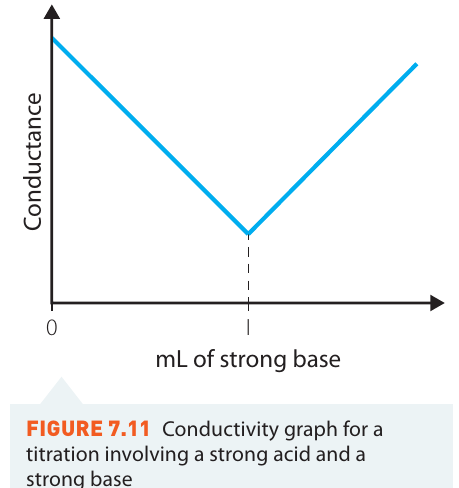
Strong acid and strong base
Using and as examples:
Before equivalence point:
- High conductance due to highly mobile ions
- Conductivity decreases as is replaced by less mobile
- reacts with to form weakly ionised water
At equivalence point:
- Minimum conductance
- Only and ions present
After equivalence point:
- Conductivity increases due to excess and ions
- The graph shows a V-shape with the minimum at equivalence
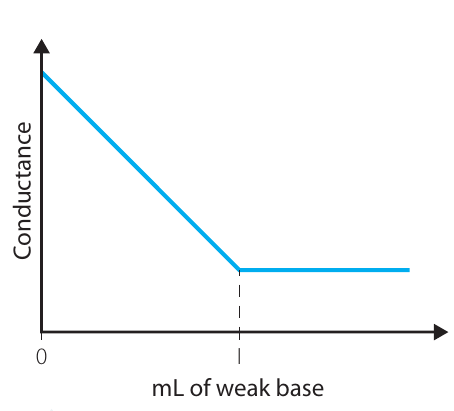
Strong acid and weak base
- Starts with high conductance (highly mobile ions)
- Decreases as is replaced
- Minimum at equivalence point
- Nearly horizontal after equivalence (weak base does not ionise significantly)
- The graph shows a check-mark shape
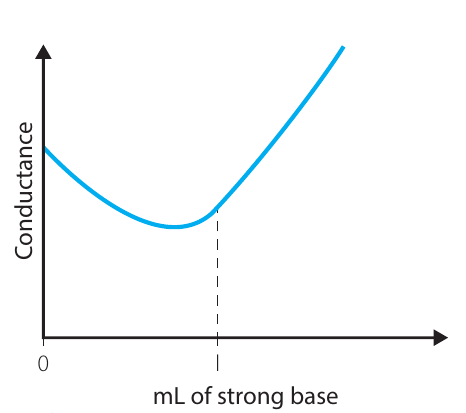
Weak acid and strong base
This shows interesting behaviour due to the common ion effect:
Before equivalence point:
- Low initial conductance (weak acid has low degree of ionisation)
- Slight decrease in conductivity initially
- The weak acid anion suppresses further ionisation of the weak acid (Le Chatelier's principle)
For example, with ethanoic acid:
Adding drives the equilibrium backwards.
Near equivalence point:
- Graph curves due to hydrolysis of the basic salt produced
- Strong base reacts with unionised weak acid molecules
After equivalence point:
- Rapid increase in conductivity due to excess strong base
- The graph shows a U-shape
The U-shape in weak acid-strong base titrations is distinctive because of the initial low conductivity from the weak acid. As the basic salt forms and excess base is added, conductivity increases significantly, creating the upward curve on the right side of the graph.
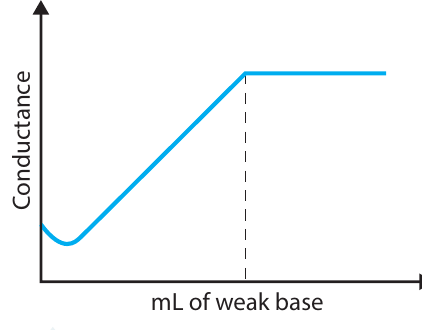
Weak acid and weak base
- Low initial conductance (weak acid has low ionisation)
- Similar initial shape to weak acid-strong base
- After equivalence point, little change in conductivity
- Weak base does not dissociate significantly
- The graph shows a gentle curve with little change after equivalence
Back titrations
What is a back titration
A back titration is an indirect analytical method used when direct titration is not suitable. It involves:
- Adding a known excess of reagent to the sample
- Allowing the reaction to go to completion
- Titrating the excess reagent with a standard solution
- Calculating the amount that reacted with the sample
When to use back titrations
Back titrations are appropriate when:
- The end point is difficult to determine (reaction too slow)
- The sample is not soluble in water but reacts with an acid
- The sample is toxic, volatile or gaseous
- The sample is in a mixture of gases
- The sample is fairly unreactive (too weak for a clear end point)
- The sample is present in low concentration or trace amounts
Back titrations are essential when direct titration is impractical or impossible. The key requirement is that the sample must react completely with the added excess reagent, even if it cannot be titrated directly.
Example: Calcium carbonate in limestone
This is a classic back titration application because calcium carbonate does not dissolve in water.
Step 1: Add excess standardised to limestone sample
Step 2: Heat to ensure complete reaction and release all
Step 3: Titrate excess with standardised
Step 4: Calculate moles of that reacted with :
Worked Example: Calculating Calcium Carbonate Percentage
A sample of limestone was dissolved in of hydrochloric acid. After heating, the solution was cooled and diluted to . A sample was titrated with of sodium hydroxide. Calculate the percentage of calcium carbonate.
Solution:
Balanced equations:
Step 1: Calculate initial moles of :
Step 2: Calculate moles of used in titration:
Step 3: Therefore, moles of in sample:
Step 4: Moles of in solution:
Step 5: Moles of that reacted with :
Step 6: Moles of (using ratio):
Step 7: Mass of (molar mass = ):
Step 8: Percentage:
Answer: The limestone contains 88% calcium carbonate.
Other applications of back titrations
Back titrations are also used for analysing:
- Nitrogen content in lawn fertilisers (present as ammonium salts)
- Aspirin content in painkiller tablets
- Alcohol content in wine
Redox titrations
Introduction to redox titrations
Redox titrations use oxidation-reduction reactions for volumetric analysis. Like other titrations, determining the equivalence point is essential.
Determining the end point
Two methods are commonly used:
Natural colour of ions: Transition metal salts in different oxidation states have different colours. For example, (manganese(VII)) is purple, while (manganese(II)) is pale pink.
Indicators: Appropriate redox indicators can be used when natural colour changes are not visible.
The use of natural colour changes in redox titrations is a significant advantage. It eliminates the need for separate indicators in many cases, such as with permanganate () titrations where the intense purple colour provides a self-indicating end point.
Primary standard for redox titrations
Hydrated iron(II) ammonium sulfate, , is commonly used as an analytical grade (AR grade) primary standard because it:
- Has a large molar mass
- Has high purity
- Can be directly weighed accurately
- Does not react with the atmosphere
- Remains stable for long periods
- Is readily available
Example: Standardising potassium permanganate
The reaction between iron(II) and permanganate ions is:
Oxidation reaction:
Reduction reaction:
Overall reaction:
End point detection: The end point is reached when the first permanent pink-purple colour appears, indicating a very slight excess of . This single drop of excess is negligible in the total volume. The colour persists because there is no more available to reduce the permanganate.
Applications of redox titrations
Redox titrations are useful for determining:
- Ascorbic acid (vitamin C) content in foods
- Alcohol (ethanol) content in wine
- Sulfur dioxide () content in wine
Advantage over acid-base titrations: Redox titrations specifically target one substance. For example, when analysing vitamin C, a redox titration reacts only with ascorbic acid, whereas an acid-base titration would react with all acids present in the food. This selectivity makes redox titrations more accurate for specific analytes in complex mixtures.
Safety considerations for all titrations
When performing any type of titration, consider these safety measures:
- Wear safety glasses at all times
- Wash hands after handling chemicals
- Keep glassware away from bench edges
- Handle concentrated acids with extreme care (teacher to dispense)
- Use fume cupboards when working with volatile or toxic substances
- Wear gloves and lab coats when handling staining chemicals (like iodine)
- Report any broken glassware immediately
Key Points to Remember:
-
pH curves are essential when indicators cannot be seen due to coloured or turbid solutions; the equivalence point is at the midpoint of the steep pH change section, and its pH value depends on the strength of the acid and base used
-
Conductometric titrations measure conductivity changes and are useful for very dilute solutions, coloured solutions, and incomplete reactions; the equivalence point appears as a minimum or inflection point on the graph, with distinctive shapes (V-shape, U-shape, or check-mark) depending on acid-base strengths
-
Back titrations are used when direct titration is unsuitable (insoluble samples, slow reactions, or trace amounts); excess reagent is added, then the unreacted portion is titrated to calculate the amount that reacted with the sample
-
Redox titrations involve oxidation-reduction reactions and often use natural colour changes (like permanganate's purple colour) to indicate the end point without requiring separate indicators; they offer selectivity by targeting specific oxidation states