Mass Spectroscopy (HSC SSCE Chemistry): Revision Notes
Mass Spectroscopy
Introduction to mass spectroscopy
Mass spectrometry is a powerful analytical technique that reveals detailed information about the structure of chemical substances. This method can determine the molar mass of compounds, identify which elements are present, and even detect different isotopes of elements.
Mass spectrometry has numerous practical applications in the real world. Scientists use it to radioactively date ancient fossils, detect prohibited drugs in sports supplements, and analyze particles carried by solar wind on satellites. One of the major advantages of this technique is that it requires only a tiny amount of sample material whilst providing a wealth of structural information.
Comparison with other spectroscopic techniques
Different analytical techniques use different types of energy to analyze substances:
- Mass spectroscopy uses high-energy electrons
- Nuclear magnetic resonance (NMR) spectroscopy uses radio waves
- Infrared (IR) spectroscopy uses heat energy
- Ultraviolet-visible (UV-vis) spectrophotometry uses visible or UV light
The key difference with mass spectrometry is that it actually breaks molecules apart using high-energy electrons, whereas the other techniques simply interact with molecules using lower-energy electromagnetic radiation.
Principles of mass spectrometry
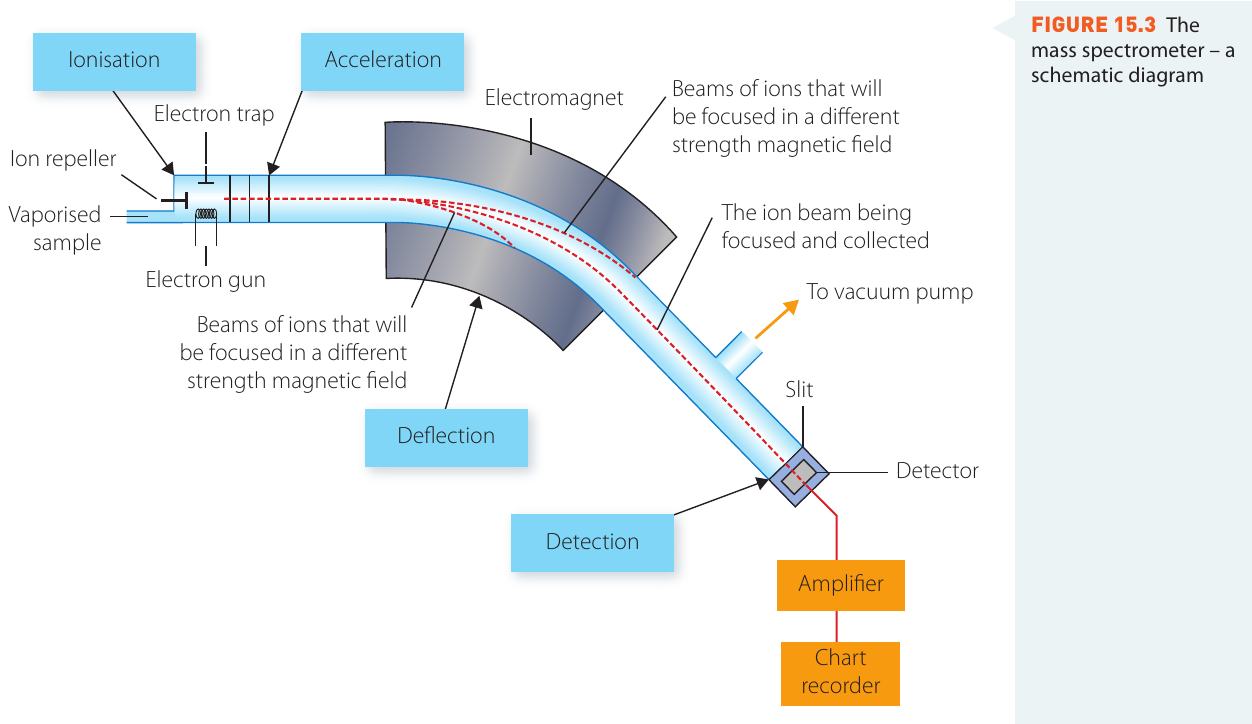
Components of a mass spectrometer
A mass spectrometer consists of four main components that work together to analyze chemical samples:
- Ionization chamber - where the sample is ionized
- Acceleration region - where ions are speeded up
- Deflection region - where ions are separated by a magnetic field
- Detection system - where ions are collected and measured
The ionization process
The analysis begins when a vaporized sample enters the ionization chamber. Here's what happens step by step:
Step 1: Electron bombardment
High-energy electrons bombard the sample molecules. These electrons have enough energy to knock an electron off the molecule or atom.
Step 2: Formation of molecular ions
When an electron is removed, the resulting particle becomes positively charged. This positively charged particle is called a molecular ion or parent molecular ion. Usually, only one electron is knocked off, giving the ion a charge of +1.
Step 3: Formation of radicals
In the original molecule, every electron was paired. When one electron is knocked off, the molecular ion has an unpaired electron. This makes it a radical, which we represent using the symbol '•'.
Formation of a Molecular Ion: Methane
When methane is bombarded with high-energy electrons, it loses one electron to form a molecular ion:
In this equation:
- A methane molecule gains enough energy from a bombarding electron
- It releases one of its own electrons
- The result is a methane molecular ion () with an unpaired electron
- Two free electrons are produced in total
Acceleration and deflection
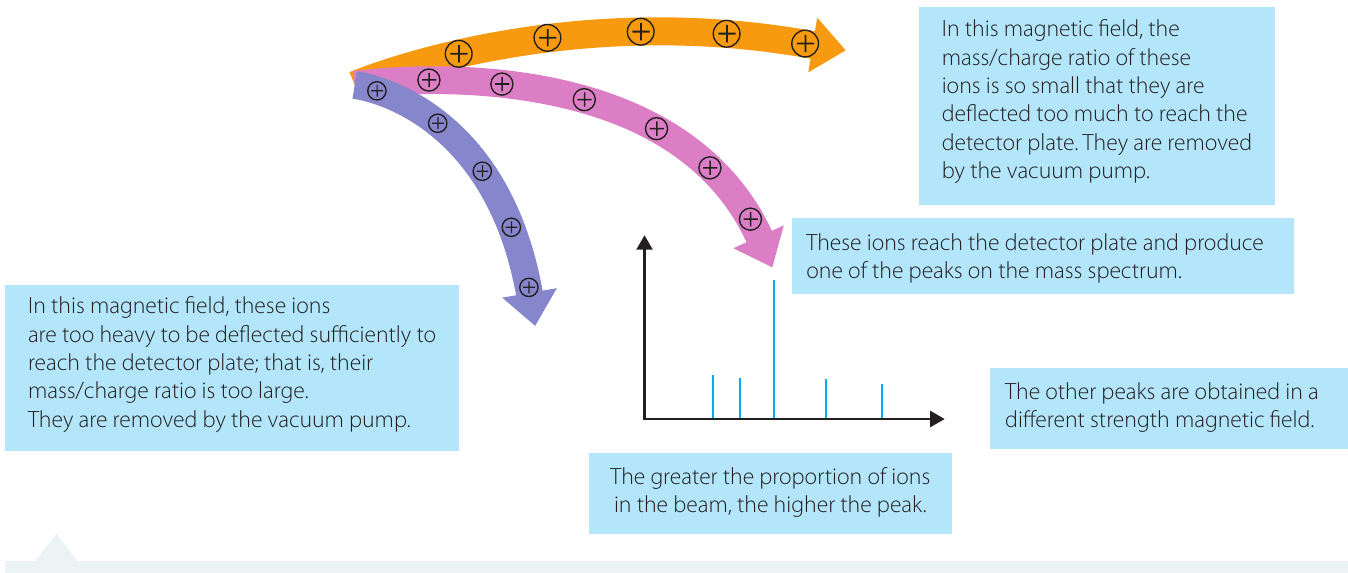
Once formed, the positively charged ions are accelerated along the path by an electrical field. They then pass through a magnetic field, which deflects (bends) the ions based on two factors:
- Mass (m) - heavier ions are harder to deflect
- Charge (z) - higher charged ions are easier to deflect
This means smaller, more highly charged particles deflect more easily than larger, less charged particles. By varying the strength of the magnetic field, ions can be separated according to their mass-to-charge ratio (m/z).
Remember the rule: Heavy ions stay relatively straight through the magnetic field, while light ions bend more dramatically. This separation by mass is what allows us to identify different ions in the sample.
Detection and measurement
Ions that are successfully deflected by the correct amount reach the detector. The intensity of the ion beam hitting the detector provides a measure of how abundant that particular ion is.
Only positively charged ions (cations) are detected. Neutral particles, including radicals without a charge, are removed by a vacuum pump and do not appear in the mass spectrum.
The results are presented as a mass spectrum - a graph plotting mass/charge ratio (m/z) on the x-axis versus relative abundance on the y-axis.
Understanding mass spectra
What is a mass spectrum?
A mass spectrum is the graph produced by a mass spectrometer. It displays a series of vertical lines (peaks) at different m/z values along the x-axis. Each peak represents a particular ion that has been detected.
Key features of mass spectra
The x-axis: m/z ratio
The x-axis shows the mass-to-charge ratio. Since most ions have a charge of +1, the m/z value usually equals the mass of the ion in atomic mass units (amu).
The y-axis: relative abundance
The y-axis shows relative abundance as a percentage. The tallest peak is assigned 100%, and all other peaks are expressed as a percentage relative to this tallest peak.
The parent molecular ion (M+•)
The most important peak is the parent molecular ion peak. This represents the intact molecule that has only lost one electron. The m/z value of this peak gives you the molar mass of the original compound.
The base peak
The base peak is the tallest peak in the spectrum - the most abundant ion. It is always assigned a relative abundance of 100%. Note that the base peak and the parent molecular ion peak may not be the same peak.
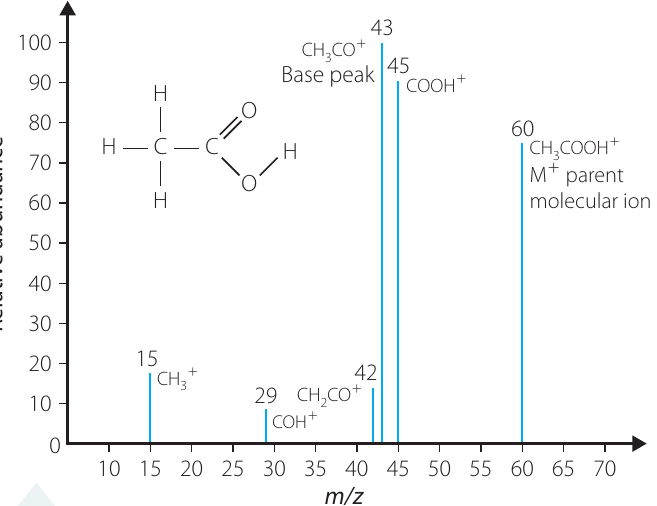
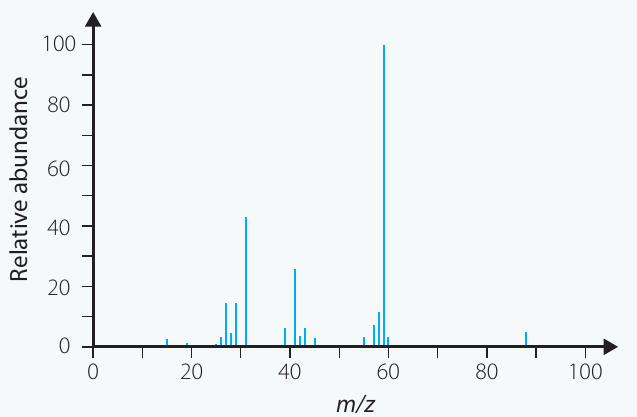
This mass spectrum shows ethanoic acid (). The parent molecular ion appears at m/z = 60, which matches the molar mass of ethanoic acid. However, the base peak appears at m/z = 43, indicating that the fragment is the most abundant ion in the spectrum.
Don't confuse the parent molecular ion with the base peak!
- The parent molecular ion gives you the molar mass of the compound (may not be the tallest peak)
- The base peak is the tallest peak in the spectrum (may not be the parent ion)
These are often different peaks because the parent ion frequently fragments into more stable smaller ions.
Fragmentation patterns
Why fragmentation occurs
When high-energy electrons bombard organic molecules, they can cause the molecular ion to break apart. This process is called fragmentation. The parent molecular ion can fragment to form:
- A smaller positively charged ion (a cation)
- A neutral free radical (uncharged)
Remember: only the cation is detected by mass spectrometry; neutral radicals are not detected.
Fragmentation of methane
Let's look at how methane fragments:
or
In these examples, only the (m/z = 15) and (m/z = 1) would be detected. The neutral radicals ( and ) would not appear in the mass spectrum.
Using fragmentation patterns
Fragmentation patterns provide valuable clues about molecular structure. Different functional groups and molecular fragments produce characteristic peaks at specific m/z values.
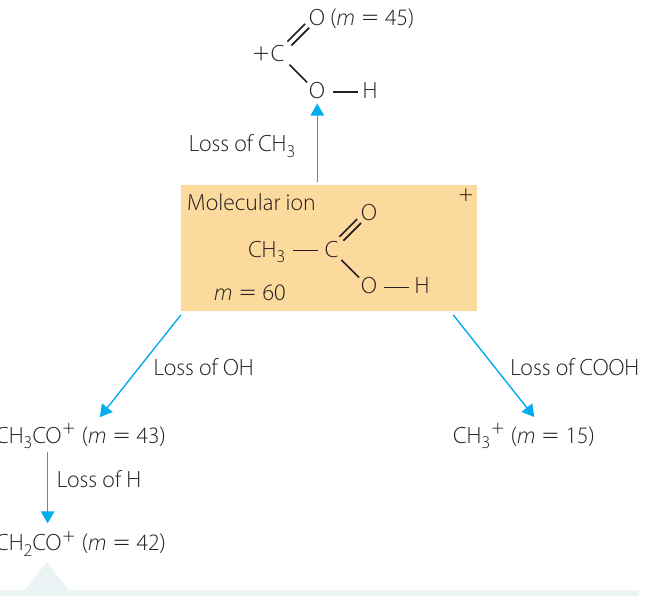
This diagram shows how ethanoic acid fragments. The parent ion at m/z = 60 can break apart in several ways:
- Loss of produces at m/z = 45
- Loss of OH produces at m/z = 43
- Loss of H produces an ion at m/z = 59
- Loss of COOH produces at m/z = 15
Common fragment ions
Certain fragments appear frequently in organic mass spectra. Here's a reference table of common fragmentations:
| Relative mass (m/z) | Fragment |
|---|---|
| 15 | |
| 17 | OH |
| 18 | |
| 29 | , CHO |
| 31 | |
| 45 | COOH, |
Exam tip: Memorize these common fragments - they frequently appear in exam questions!
The most common ones to remember are:
- m/z = 15: Always (methyl group)
- m/z = 17: Always OH (hydroxyl group)
- m/z = 29: Either (ethyl) or CHO (aldehyde)
- m/z = 45: Either COOH (carboxyl) or (ethoxy)
Interpreting peaks using mass differences
You can also analyze mass spectra by looking at differences between peaks:
- If the parent peak is at 60 and there's a peak at 45, the difference of 15 suggests loss of a methyl group ()
- If there's a peak 17 less than the parent peak, this suggests loss of a hydroxyl group (OH)
- A peak 1 less than the parent suggests loss of a hydrogen atom (H)
Isotopes in mass spectrometry
Isotopic composition of common elements
The main elements in organic compounds - carbon, hydrogen, and oxygen - exist as different isotopes. Here's the isotopic composition of these elements:
| Element | Isotope | Relative isotopic mass | Abundance (%) |
|---|---|---|---|
| Hydrogen | 1.0078 | 99.99 | |
| 2.0141 | ~0.01 | ||
| 3.0160 | <<0.02 | ||
| Carbon | 12.000 | 98.93 | |
| 13.003 | 1.07 | ||
| 14.003 | ~ | ||
| Oxygen | 15.995 | 99.757 | |
| 16.999 | 0.038 | ||
| 17.999 | 0.205 |
Impact on mass spectra
Because mass spectra show peaks based on the mass of molecules and fragments, the presence of isotopes can create additional small peaks. However, as the table shows, most isotopes have very low abundance (typically less than 2%).
For organic compound identification, these small isotopic peaks can usually be ignored. You should focus on the major peaks when analyzing mass spectra of organic molecules.
Exception: If you're analyzing a pure element (not an organic compound), the different peaks will be due to isotopes of that element, and the peak heights indicate the relative abundance of each isotope.
Worked example: identifying an unknown alkane
Worked Example: Identifying an Unknown Alkane from its Mass Spectrum
Given information:
- The mass spectrum shows peaks at m/z values of 15, 28, 29, 43, and 44
- The compound is known to be an alkane
- The tallest peak (base peak) appears at m/z = 29
Step 1: Identify the parent molecular ion
The largest m/z value in the spectrum is 44. This represents the parent molecular ion, so the molar mass of the unknown compound is 44 amu.
Step 2: Determine the molecular formula
Since we know it's an alkane, we use the general formula for alkanes:
Let's try (propane):
- Carbon contribution:
- Hydrogen contribution:
- Total: ✓
The compound is propane ().
Step 3: Identify the fragments
Now let's explain the other peaks using our knowledge of common fragments:
- m/z = 15: This corresponds to (methyl cation)
- m/z = 29: This corresponds to (ethyl cation) - this is the base peak
- m/z = 43: This is the parent ion minus 1, suggesting loss of H to give
- m/z = 28: This is 29 minus 1, suggesting (loss of H from the ethyl cation)
Step 4: Draw the fragmentation pattern
We can represent these fragmentations as:
This analysis confirms our identification of the compound as propane.
Remember!
Key Points to Remember:
-
Mass spectrometry uses high-energy electrons to knock electrons off molecules, creating positively charged ions that can be detected and measured.
-
The parent molecular ion peak gives you the molar mass of the original compound - this is the most important peak for identifying unknown substances.
-
Only cations are detected in mass spectrometry. Neutral radicals formed during fragmentation are removed by the vacuum pump and don't appear in the spectrum.
-
The base peak is the tallest peak in the spectrum (100% relative abundance) and represents the most stable or abundant fragment ion. It may not be the same as the parent molecular ion peak.
-
Fragmentation patterns provide structural clues. By recognizing common fragments (like m/z = 15 for , m/z = 17 for OH, and m/z = 45 for COOH) and analyzing mass differences between peaks, you can deduce the structure of unknown organic molecules.