Melting Point, Atomic Radius, and Ionisation Energy (HSC SSCE Chemistry): Revision Notes
Melting Point, Atomic Radius, and Ionisation Energy
Introduction to periodicity
Periodicity refers to the regular, repeating pattern of properties or events. Just as sunrise occurs once every 24 hours in a predictable pattern, the properties of chemical elements also follow regular patterns. This observation led Russian chemist Dmitri Mendeleev in 1869 to develop what we now call the periodic law.
The modern periodic law states that the properties of elements vary in a regular, repeating pattern when arranged by their atomic numbers. This fundamental principle forms the basis for the organisation of the periodic table.
Mendeleev used this principle to create the periodic table, a systematic chart that organises elements based on their recurring properties. This chapter examines how three key properties - melting point, atomic radius, and ionisation energy - vary periodically across the periodic table, and explains these patterns using atomic structure.
Melting point and physical state
Melting point is one property that demonstrates clear periodicity when plotted against atomic number. The graph below shows how melting points vary across the periodic table.
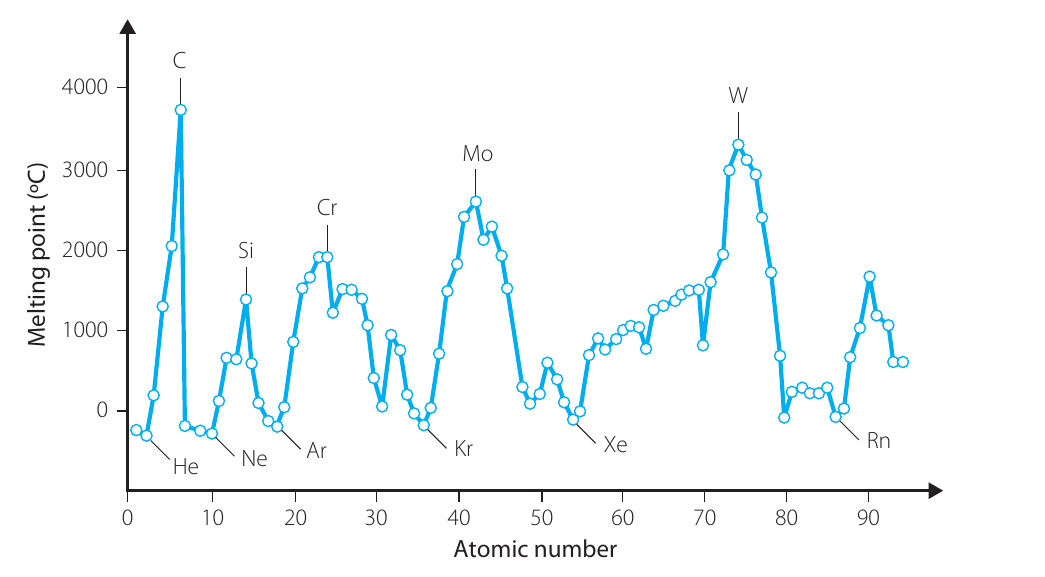
The curve reveals a distinctive pattern with regular peaks and troughs. The lowest points (minima) correspond to the noble gases (He, Ne, Ar, Kr, Xe, Rn), whilst the highest points (maxima) occur at carbon and silicon in group 14, and at transition metals in group 6 (Cr, Mo, W).
Physical state at room temperature
Most elements exist as solids at room temperature. The gaseous elements are found on the right side of the periodic table, particularly in groups 17 (halogens) and 18 (noble gases). An interesting trend appears when examining these groups:
For the halogens (group 17), the physical state changes as you move down the group:
- Fluorine () and chlorine () are gases
- Bromine () is a liquid
- Iodine () is a solid
This pattern of changing from gas to solid occurs in groups 15 and 16 as well. The trend shows that boiling points increase as you descend these groups. For other groups in the periodic table, no consistent patterns emerge in melting and boiling points - the elements simply remain solids throughout.
A substance's physical state at room temperature depends on its melting and boiling points:
- Solid: melting point above room temperature
- Liquid: melting point below room temperature but boiling point above room temperature
- Gas: boiling point below room temperature
Atomic radius
Atomic radius measures the size of an atom and shows very clear periodic behaviour when examined across the periodic table.
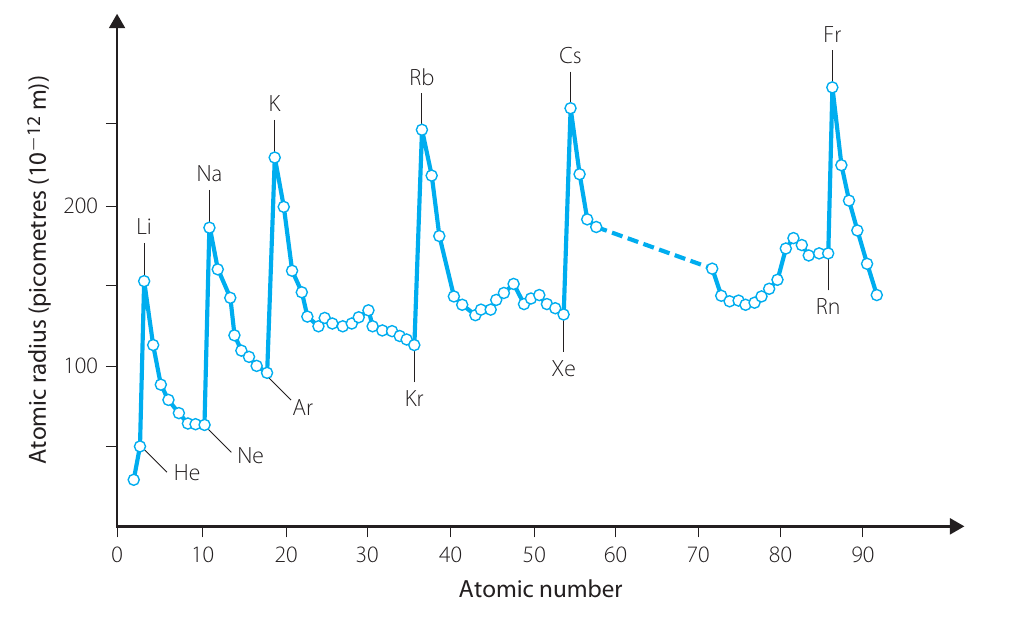
The graph above demonstrates distinct periodicity. The atomic radius reaches maximum values (peaks) at the alkali metals (Li, Na, K, Rb, Cs, Fr in group 1), whilst minimum values (troughs) occur at the noble gases (He, Ne, Ar, Kr, Xe, Rn in group 18). This pattern reveals two important trends:
- Across a period: Atomic radius decreases from left to right
- Down a group: Atomic radius increases from top to bottom
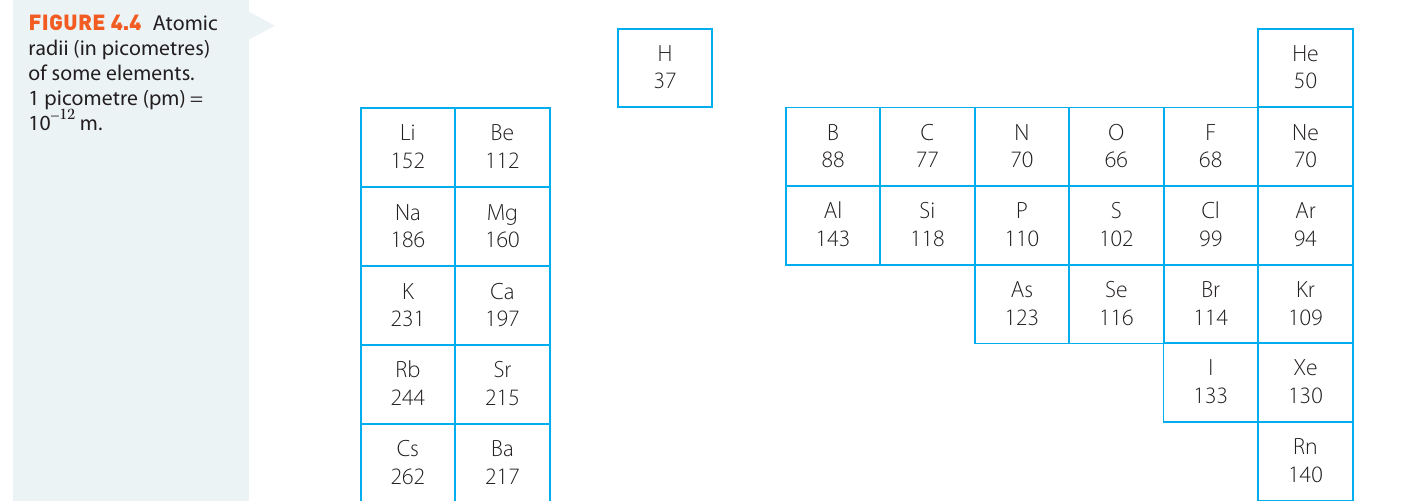
The periodic table above shows atomic radii measured in picometres (, where ). Notice how hydrogen () has one of the smallest radii, whilst caesium () has one of the largest. The values clearly illustrate both trends: decreasing size across periods and increasing size down groups.
Explaining trends in atomic radius
Understanding why atomic radius changes in these patterns requires examining the structure of atoms and the forces within them.
Why atomic radius decreases across a period:
When moving from left to right across a period, several key factors are at play:
- All outermost electrons occupy the same main energy level, giving them similar energies
- The number of protons in the nucleus increases with each successive element
As the nuclear charge (number of protons) increases, the force of attraction between the nucleus and each outermost electron becomes stronger. This stronger pull draws the electrons closer to the nucleus, reducing the atomic radius. Therefore, atomic size decreases across a period.
Why atomic radius increases down a group:
Moving down a group involves different competing factors:
- The nuclear charge (number of protons) increases
- The outermost electrons occupy progressively higher energy levels
- Electrons in higher energy levels are further from the nucleus and have more energy
Higher energy electrons can better resist the stronger nuclear attraction. These two effects - increasing nuclear charge pulling electrons in, and increasing electron energy pushing outward - largely cancel each other out.
However, a third factor becomes crucial: the screening effect (also called shielding). The screening effect occurs when completely filled inner electron shells sit between the nucleus and the outermost electrons. This 'sea' of negative charge from inner electrons partially blocks the positive charge of the nucleus. As a result, the nucleus cannot attract the outer electrons as strongly as it would without this shielding.
The screening effect weakens the electrostatic attraction, allowing the atomic radius to increase. This explains why atomic size increases down a group.
Ionisation energy
When an atom loses or gains electrons, it becomes electrically charged because the balance between protons and electrons changes. These charged particles are called ions. Specifically, when an atom loses an electron, it forms a positive ion. For example, a sodium atom losing one electron becomes a sodium ion, written as . The process of removing an electron from an atom is called ionisation.
Removing an electron requires energy because work must be done against the electrostatic attraction between the negative electron and the positive nucleus. This energy is called the ionisation energy.
First ionisation energy
The first ionisation energy () of an element is the energy needed to remove one electron from a neutral gaseous atom. The process can be represented as:
where represents any element. The lower the ionisation energy, the easier it is to remove an electron from that element.
Ionisation energy is typically measured in kilojoules per mole of atoms (). For now, think of a mole as a specific number of atoms (approximately atoms), similar to how a dozen always means 12.
Ionisation energy and the periodic table
First ionisation energy shows remarkably clear periodic variation across the periodic table.
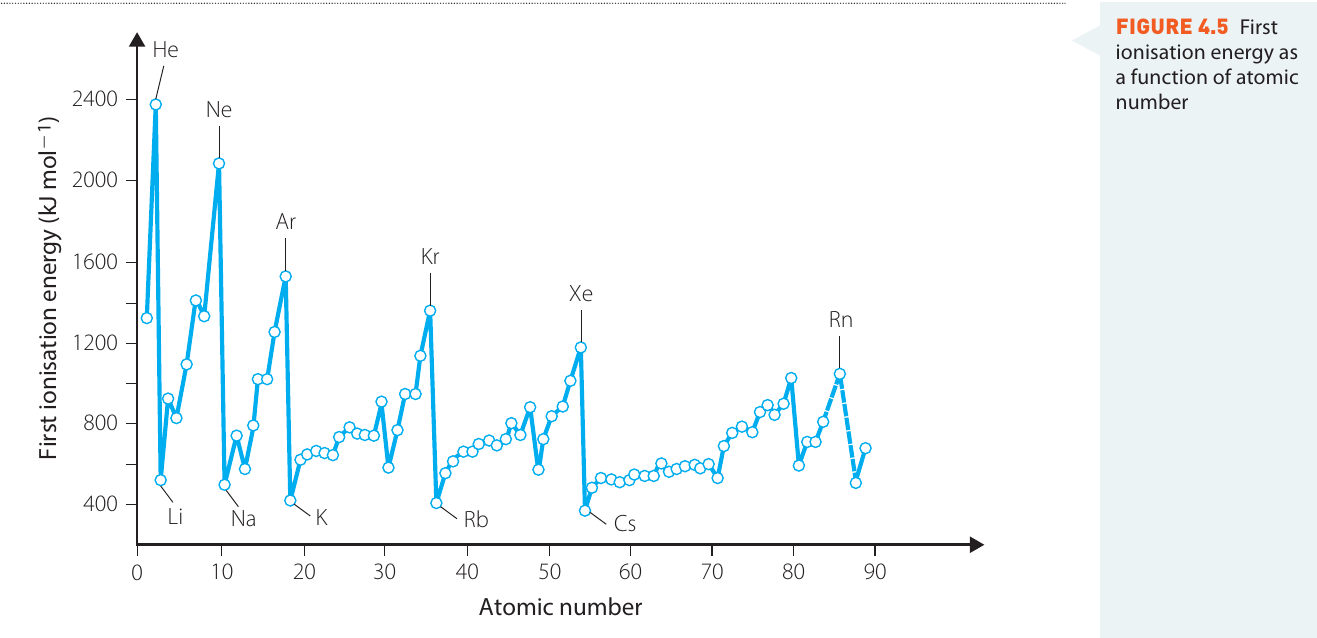
The graph demonstrates obvious periodicity. The minimum values occur at the alkali metals (Li, Na, K, Rb, Cs), meaning it is relatively easy to remove an electron from these elements. In contrast, the noble gases (He, Ne, Ar, Kr, Xe, Rn) show maximum ionisation energies, indicating it is very difficult to remove an electron from these stable elements.
This confirms that noble gas electron configurations are extremely stable. The high ionisation energies of noble gases demonstrate why these elements rarely form chemical bonds or react with other substances.
The periodic table below presents ionisation energy data in a different format, making the trends even clearer.
| H | He | ||||||||||||||||
|---|---|---|---|---|---|---|---|---|---|---|---|---|---|---|---|---|---|
| 1320 | 2380 | ||||||||||||||||
| Li | Be | B | C | N | O | F | Ne | ||||||||||
| 526 | 905 | 810 | 1090 | 1410 | 1320 | 1690 | 2090 | ||||||||||
| Na | Mg | Al | Si | P | S | Cl | Ar | ||||||||||
| 504 | 740 | 580 | 790 | 1020 | 1000 | 1260 | 1526 | ||||||||||
| K | Ca | As | Se | Br | Kr | ||||||||||||
| 425 | 600 | 953 | 950 | 1150 | 1360 | ||||||||||||
| Rb | Sr | I | Xe | ||||||||||||||
| 410 | 560 | 1020 | 1180 | ||||||||||||||
| Cs | Ba | Rn | |||||||||||||||
| 380 | 510 | 1040 |
These data clearly show two key trends:
- Across a period: First ionisation energy increases from left to right. This means elements become less likely to lose electrons as you move across.
- Down a group: Ionisation energy decreases from top to bottom. This means electrons are lost more easily as you descend a group.
These trends provide strong support for the periodic law that properties vary regularly with atomic number.
Successive ionisation energies
Each element can lose multiple electrons, giving rise to first, second, third (and higher) ionisation energies. The second ionisation energy represents the energy needed to remove a second electron:
The second ionisation energy is always greater than the first. This makes sense: it requires more energy to remove a negatively charged electron from a positive ion than from a neutral atom, due to the greater electrostatic attraction.
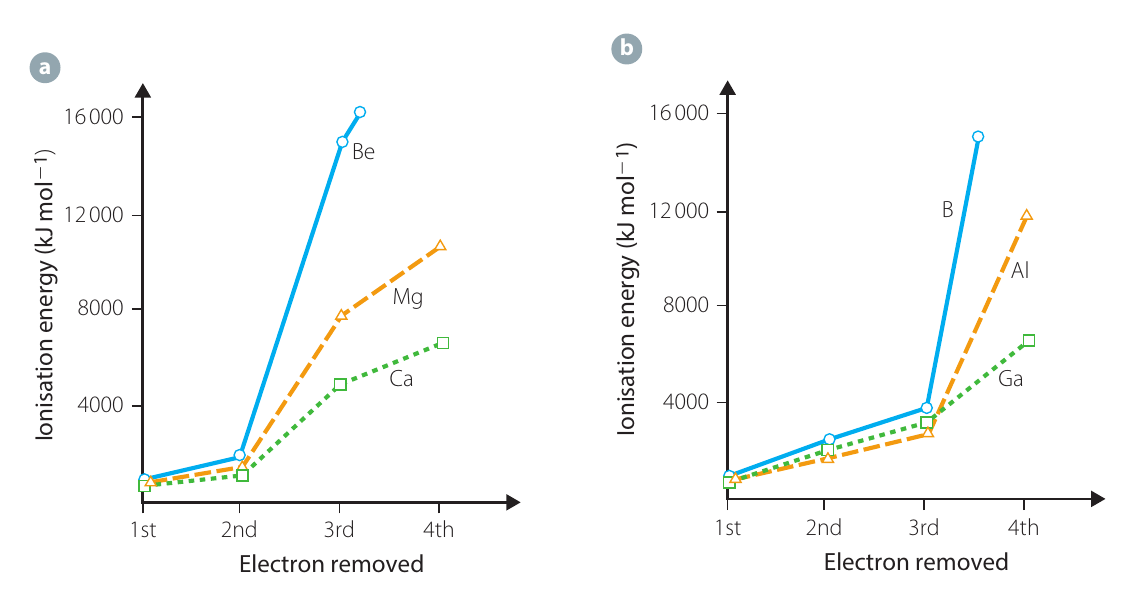
The graphs above show successive ionisation energies for elements in groups 2 and 13. In graph (a), removing one or two electrons from Be, Mg, and Ca requires relatively modest energy, but removing the third electron requires dramatically more energy. Similarly, in graph (b), removing one, two, or three electrons from B, Al, and Ga is relatively easy, but the fourth electron requires far more energy to remove.
The table below shows this pattern for group 1 elements:
| Element | First | Second | Third | Fourth |
|---|---|---|---|---|
| Li | 526 | 7300 | 11,800 | - |
| Na | 504 | 4570 | 6920 | 9550 |
| K | 425 | 3080 | 4400 | 5880 |
| Rb | 410 | 2660 | 3900 | 5100 |
| Cs | 380 | 2430 | 3400 | 4900 |
All values in
Worked Example: Understanding Successive Ionisation Energies
For lithium (Li), observe the dramatic increase in ionisation energies:
- First ionisation energy: 526 kJ mol⁻¹ (relatively easy to remove)
- Second ionisation energy: 7300 kJ mol⁻¹ (nearly 14 times greater!)
This huge jump occurs because after losing one electron, lithium achieves the helium noble gas configuration. The remaining electrons are in a lower, more stable energy shell and are held much more tightly by the nucleus.
For group 1 elements, removing one electron is relatively easy, but removing a second electron becomes extremely difficult. This pattern supports an important principle: elements tend to lose (or gain) electrons to achieve the electron configuration of the nearest noble gas.
Once elements in groups 1, 2, and 13 have lost one, two, or three electrons respectively, the resulting ions possess noble gas configurations. Removing additional electrons would require taking them from lower energy shells, which are held much more tightly by the nucleus. This explains the dramatic jump in ionisation energy.
Explaining trends in ionisation energies
The trends in ionisation energy closely mirror the trends in atomic radius, but in reverse: as atomic radius increases, first ionisation energy decreases. This inverse relationship provides the key to understanding ionisation energy trends.
Both properties depend on the strength of electrostatic attraction between the nucleus and the outermost electrons. Stronger attraction means:
- Smaller atomic radius (electrons held closer)
- Higher ionisation energy (more energy needed to remove electrons)
Across a period:
Moving from left to right across a period, the electrostatic attraction between the nucleus and each outermost electron increases because:
- The nuclear charge (number of protons) increases
- The outermost electrons remain in the same energy level
This stronger attraction makes it progressively harder to remove electrons. Therefore, first ionisation energy increases across a period.
Down a group:
Moving down a group, the electrostatic attraction between the nucleus and the outermost electrons decreases due to:
- Increased distance (electrons in higher energy levels)
- Greater screening effect from inner electron shells
This weaker attraction makes it easier to remove electrons. Therefore, ionisation energy decreases down a group.
The screening effect plays a crucial role in explaining the down-group trend. Inner electron shells shield the outer electrons from the full positive charge of the nucleus, reducing the effective nuclear charge experienced by valence electrons.
Remember!
Key Points to Remember:
-
Periodicity means properties repeat in regular patterns across the periodic table based on atomic number.
-
Atomic radius decreases across a period (left to right) due to increasing nuclear charge pulling electrons closer, but increases down a group due to electrons occupying higher energy levels and increased screening.
-
Melting points vary periodically with minima at noble gases and maxima at carbon, silicon, and certain transition metals. Physical state changes from gas to solid down groups 15-18.
-
First ionisation energy increases across a period as electrons become harder to remove, but decreases down a group as electrons become easier to remove.
-
Elements readily lose or gain electrons to achieve noble gas configurations, as shown by dramatic jumps in successive ionisation energies once a noble gas configuration is reached.