The Role of Government in Australia (HSC SSCE Economics): Revision Notes
The Reallocation of Resources and the Redistribution of Income
The reallocation of resources
Resource reallocation occurs when government intervenes to shift production patterns in the economy. The government directs resources toward goods and services it considers beneficial for society, whilst discouraging production of less desirable items. This intervention aims to promote more efficient use of Australia's scarce resources and address market failures.
Government can influence resource allocation through three primary mechanisms:
- Using taxation or spending measures to change business and consumer behaviour in markets
- Producing goods and services directly (such as public goods and infrastructure)
- Implementing regulatory policies (for example, age restrictions on purchasing cigarettes, firearms and fireworks)
Taxation and resource allocation
Taxation serves dual purposes: generating government revenue and influencing economic behaviour. By affecting prices, taxes can redirect resources away from or toward specific activities.
Direct taxes must be paid by the person or business on whom they're imposed—they cannot be shifted to others. Personal income tax is the clearest example: the individual earning the income must pay the tax. Company tax and capital gains tax are also direct taxes.
Indirect taxes are levied on individuals or businesses but can be passed on to others. These taxes attach to goods or services rather than to specific taxpayers. The Goods and Services Tax (GST) exemplifies indirect taxation—whilst levied on sellers, it's typically passed to consumers through higher prices.
Governments strategically use indirect taxes to discourage production of certain goods. High tobacco taxes aim to deter smoking uptake and encourage existing smokers to quit. These taxes also reflect the higher healthcare costs that smokers impose on the public health system, as they face significantly elevated risks of various diseases.
During the 1980s, the government increased prices on leaded petrol (required for older vehicles) to encourage consumers to switch to unleaded petrol, which causes less environmental damage. Leaded petrol is now completely banned. Variable road pricing—charging higher tolls during peak hours—represents another example of using revenue measures to influence behaviour and reduce traffic congestion.
Case study: Encouraging private health insurance
In the late 1990s, the federal government implemented both direct and indirect taxation measures to boost Australia's declining private health insurance rates. The policy aimed to reduce pressure on public hospitals by encouraging private healthcare system usage.
Higher-income earners without private health insurance pay a Medicare Levy Surcharge on their income tax. For singles earning over $90,000, the surcharge is 1%, rising to 1.25% above $105,000 and 1.5% above $140,000. Family thresholds are double these amounts.
The government also provides a Private Health Insurance rebate to subscribers, though this has become means-tested since 2013. Singles under 65 earning below $90,000 receive a 25.1% rebate, whilst those earning $90,001-$105,000 receive 16.7%, and those earning $105,001-$140,000 receive 8.4%. Singles earning above $140,000 receive no rebate.
This policy demonstrates how governments use both penalties (surcharges) and incentives (rebates) to reallocate resources toward preferred outcomes.
Government spending
Government spending can directly reallocate resources to particular sectors or influence decisions made by consumers and businesses. This intervention addresses market failures—situations where private markets fail to provide allocations matching community needs and preferences.
Government spending examples include:
- Arts funding: Supporting cultural activities that might otherwise be commercially unviable
- Start-up grants: Providing capital to new businesses or growth industries that lack proven track records for conventional financing
- Telecommunications subsidies: Funding companies like Telstra to provide broadband services in regional areas where commercial provision would be unprofitable
- Employment services: Cash payments to private employment agencies that find jobs for unemployed people
Whilst these spending measures alone may not substantially shift overall resource allocation, they can influence private sector decisions. Government subsidies for venture capitalists might encourage additional private investment. Similarly, government spending can encourage consumer purchases by reducing industry costs and therefore lowering consumer prices.
Government provision of goods and services
Governments sometimes directly engage in production to achieve better resource allocation. In Australia, governments have traditionally provided substantial basic infrastructure including roads, railways, public transport systems, electricity distribution, and postal and telecommunications networks.
During the mid-twentieth century, prevailing thought held that governments could operate enterprises more effectively than the private sector. Government ownership would serve public interests rather than profit motives. For example, the Commonwealth Bank was established in the 1930s following the Depression, when many believed self-interested banking behaviour had worsened economic hardship. The Commonwealth Government even attempted to nationalise Australia's entire banking industry in the late 1940s.
Government ownership of monopolies prevented overpricing and consumer exploitation. However, attitudes shifted during the late twentieth century. Many came to believe government enterprises operated inefficiently because they lacked strong profit incentives, ultimately increasing costs for consumers. Consequently, governments largely sold their businesses to the private sector through privatisation—the sale of public trading enterprises to private ownership. Some exceptions exist, such as NSW's $4 billion Snowy Hydro 2.0 expansion project, being built by government-owned Snowy Hydro Ltd.
Case study: The National Broadband Network
The National Broadband Network (NBN), announced by the Rudd Government in 2009, represents the most significant recent example of government provision of goods and services. The NBN aimed to upgrade Australia's communications infrastructure, drive new technology uptake, and deliver near-universal high-speed broadband coverage throughout Australia.
By establishing a government business enterprise (NBN Co Ltd) to build network infrastructure, Australia moved against the privatisation trend. The government argued that broadband infrastructure is a natural monopoly—like water or electricity infrastructure—where large upfront capital costs make multiple competing networks inefficient. Without government provision, many Australians outside major cities would lack access to high-speed broadband, creating disadvantage.
The NBN's costs and benefits remain contested. The Rudd Government argued long-term economic and social benefits would be substantial: reduced communication costs, new business applications, better educational services and healthcare. However, following a 2014 Abbott Government review, the NBN plan was modified to create a less comprehensive network at lower cost by abandoning plans to fully replace old copper wire telecommunications networks.
NBN critics argue governments shouldn't support specific technologies that might become outdated, and that government-owned enterprises displace possible private sector investment. Supporters counter that regional Australia would never receive fast broadband under purely commercial models. They also note that whilst NBN Co operates the network, private businesses compete to sell retail services to broadband users—similar to electricity markets where retail companies are separate from distribution network operators.
The NBN's performance and government's role continue attracting controversy. Former Prime Minister Malcolm Turnbull claimed "setting up a new government company [to build the NBN] was a big mistake … it was hugely expensive. And there are many billions of dollars wasted." Others argue the modified NBN left Australia with slower and less reliable networks than the original plan would have delivered. Nevertheless, connections reached nearly 6 million by 2019, resulting in faster broadband services in metropolitan and regional areas.
The redistribution of income
Governments intervene in market economies to reduce social inequality. Since the 1980s reduction in government intervention, Australia has experienced increased income inequality, raising concerns that rising inequality could undermine Australia's egalitarian character—the idea that all Australians are equal and deserve a "fair go". A generally accepted view holds that governments should act to create more equitable income distribution. The primary redistribution mechanisms are the taxation system and social welfare payments.
Income distribution and inequality
Economists divide income earners into quintiles—groups that each comprise 20% of the population. The following table shows how government benefits substantially increase incomes for the lowest two quintiles compared with other groups.
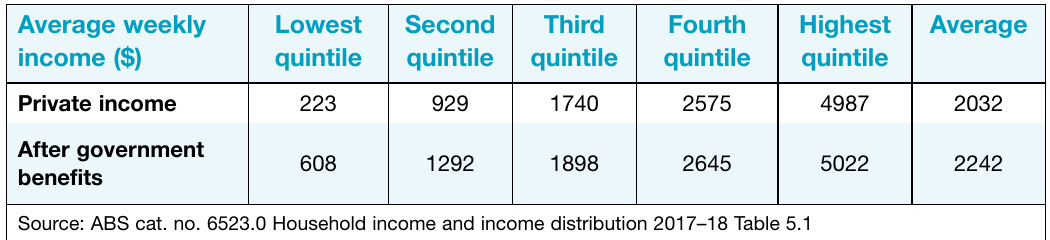
This data reveals that lower-income households receive significantly larger proportional increases from government benefits. The lowest quintile's average weekly income increases from $223 to $608 after government benefits—a rise of $385 or approximately 173%. In contrast, the highest quintile increases from $4,987 to $5,022—a rise of only $35 or approximately 0.7%.
Government intervention in Australia—through heavier taxation of wealthiest groups and redistribution via social welfare payments (benefits) to lower socio-economic groups—dramatically reduces inequality. This is clearly demonstrated by comparing income distribution before and after government intervention.
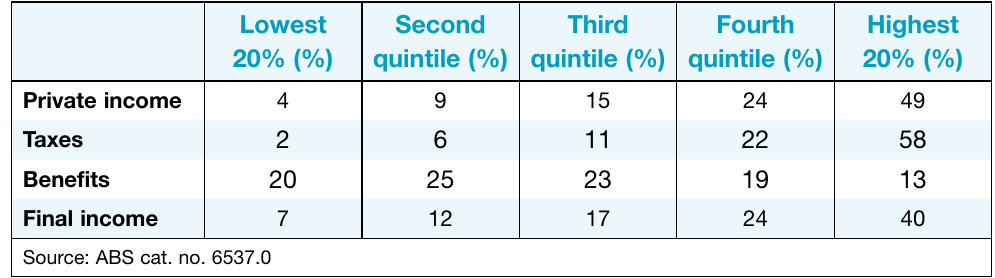
This table provides crucial insights into income distribution and government policy impacts:
- Gross income inequality is severe prior to government intervention: Private income data shows the highest 20% of income earners receive almost half (49%) of total private income, whilst the lowest 20% receive only 4%
- Taxation increases with income: As shown in the taxes row, higher earners pay disproportionately more tax. The highest quintile pays 58% of all taxes, whilst the lowest quintile pays just 2%
- Benefits are distributed progressively: The lowest quintile receives 20% of all benefits, whilst the highest quintile receives only 13%
- Income inequality after government intervention is substantially reduced: Final income data shows the highest quintile receives 40% of total income (down from 49% of private income), whilst the lowest quintile receives 7% (up from 4% of private income)
Taxation and income redistribution
Tax plays a crucial role in distributing income. Governments use taxation to redistribute income by taxing individuals at different rates. Understanding this requires knowledge of several key concepts:
Tax base: The items that are taxed. Three main bases exist for imposing taxes—income, wealth and consumption. In Australia, income forms the primary tax base.
Average rate of tax (ART): The proportion of total income earned that is paid as tax.
Marginal rate of tax (MRT): The proportion of any income increase that must be paid as tax. It represents how many cents in every extra dollar earned must be paid to government.
How the average rate of tax changes as individual income increases indicates whether the tax is:
Progressive tax: Higher-income earners pay a greater proportion of their income as tax than lower-income earners (ART rises as income increases). Personal income tax in Australia is progressive.
Regressive tax: Higher-income earners pay a smaller proportion of their income as tax than lower-income earners (ART falls as income increases). The Goods and Services Tax (GST) is regressive.
Proportional tax: All income earners pay the same proportion of their income as tax (ART remains constant as income increases). Company tax in Australia is proportional.
Australia's progressive income tax system
Australia's progressive personal income taxation system—known as Pay-As-You-Go (PAYG)—is the main instrument for redistributing income. Under PAYG, tax payments are regularly deducted from employees' wages. The system also requires almost immediate tax payments from self-employed persons and individuals who derive significant income from investment.
The following table shows income tax scales applying in the 2019-20 financial year:
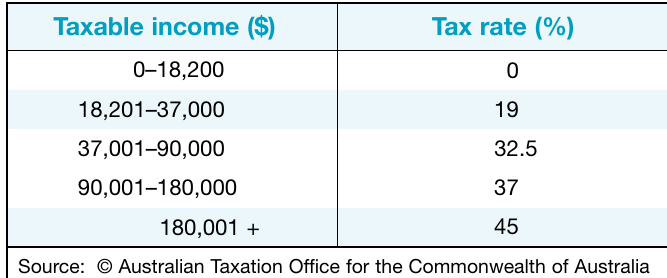
The tax-free threshold (the income level below which no income tax is paid) is $18,200. Anyone earning less than $18,200 during the financial year pays no tax. Those earning more than the threshold don't pay income tax on the first $18,200 earned. Prior to 2012-13, the tax-free threshold was only $6,000.
The lowest marginal rate of tax is 19% and applies to individuals earning between $18,201 and $37,000 for the year. This means they pay no tax on the first $18,200, and 19 cents on every dollar earned above that amount, up to $37,000.
Worked examples
Worked Example 1: Person earning $35,000
A person earning $35,000 per year has a marginal tax rate of 19% from the tax scales table. Total tax payable is calculated as follows:
Tax payable on the first $18,200 = $0
Tax payable on the next $16,800:
Total tax payable = $3,192
The average rate of tax is calculated as:
Therefore, for someone on an annual income of $35,000:
- MRT = 19%
- ART = 9.1%
Worked Example 2: Person earning $70,000
A person earning $70,000 per year has a marginal tax rate of 32.5%. Total tax payable is calculated as follows:
Tax payable on the first $18,200 = $0
Tax payable on the next $18,800:
Tax payable on the next $33,000:
Total tax payable = $14,297
The average rate of tax is calculated as:
Therefore, for someone on an annual income of $70,000:
- MRT = 32.5%
- ART = 20%
The next tax bracket covers individuals earning between $37,001 and $90,000. These people pay nothing on the first $18,200, 19 cents per dollar on income between $18,201 and $37,000, and 32.5 cents per dollar on income between $37,001 and $90,000.
The same principles apply when calculating tax payable in subsequent income brackets—up to and including the top bracket (persons earning $180,001 and above) where the marginal tax rate is 45%. These examples demonstrate the progressive nature of the personal income tax system. The person on higher income pays a higher marginal and average rate of tax compared with a lower-income earner, regardless of income source.
The GST as a regressive tax
Australia's Goods and Services Tax (GST) is the most important example of a regressive tax. The GST is regressive because it's charged as a percentage of the price of goods or services sold, irrespective of a person's income. Even though the GST applies at a flat rate of 10%, when calculated as a percentage of individual income, the percentage of income paid in tax falls as income rises.
Worked Example: GST Impact on Different Income Levels
For example, an airline ticket might be priced at $200. After GST introduction, the ticket sells for $220, meaning $20 is paid in GST by whoever purchases the ticket.
For someone earning $400 per week, the $20 paid in GST represents 5% of their weekly income. This is much larger than the burden on someone earning $2,000 per week—because $20 represents only 1% of their weekly income.
Even though both consumers pay the same absolute amount of tax, the average rate of tax is much higher for the lower-income earner. This makes the GST regressive.
Social welfare payments
The Commonwealth Government redistributes taxation revenue to lower-income earners via social welfare payments, also known as income support payments. These payments are the other major policy instrument for reducing income inequality in Australia. Social welfare payments account for around one-third of government expenditure each year, therefore considerably impacting income distribution in the economy.
Payments are often means tested, meaning people on high incomes (or those with large amounts of assets) may be ineligible to receive specific benefits. This highlights that social welfare payments are designed to reduce income inequality. Means-tested payments include unemployment benefits, family benefits and various pensions (such as age pensions, disability support pensions and single parent payments).
The largest single area of social welfare payments is the age pension. Most Australians rely on the age pension for financial security in retirement, and this will continue despite Australia having had compulsory superannuation for over two decades. Australians now enjoy close to the world's longest life expectancy. Consequently, the proportion of Australians over age 65 is projected to more than double between 2015 and 2055. The need to prepare for population ageing costs—in social welfare, healthcare, housing and other areas—will be a major policy challenge for governments in coming years.
Key points to remember:
- Resource reallocation occurs when government shifts production patterns using taxation, spending and direct provision of goods and services
- Direct taxes cannot be passed on (e.g. income tax), whilst indirect taxes can be passed on (e.g. GST)
- Progressive taxes (like income tax) mean higher earners pay a greater proportion of income as tax, redistributing income from wealthy to poor
- Regressive taxes (like GST) mean lower earners pay a greater proportion of income as tax, disproportionately affecting the poor
- Australia's tax-free threshold is $18,200, with marginal tax rates ranging from 19% to 45%
- Social welfare payments (about one-third of government spending) are often means-tested and significantly reduce income inequality
- Government intervention through taxation and benefits reduces the highest quintile's income share from 49% to 40% whilst increasing the lowest quintile's share from 4% to 7%
Key terms:
- Quintiles: Five groups each comprising 20% of the population
- ART (Average Rate of Tax): Total tax paid as a proportion of total income
- MRT (Marginal Rate of Tax): Tax paid on each additional dollar earned
- PAYG: Pay-As-You-Go tax system where tax is deducted from wages regularly
- Means testing: Eligibility for benefits based on income or assets
- Privatisation: Government sale of public enterprises to the private sector
Critical formula: