Grouped Frequency and Cumulative Frequency (HSC SSCE Mathematics Standard): Revision Notes
Grouped Frequency and Cumulative Frequency
Introduction to grouped data
When you have a dataset with many different values spread across a large range, it can be difficult to work with individual scores. The solution is to organize the data into groups called class intervals. This makes patterns easier to spot and calculations more manageable.
Grouped frequency tables
What is a grouped frequency table?
A grouped frequency table organizes data by grouping values into intervals and counting how many data values fall into each interval. This type of table is particularly useful when dealing with large datasets or data with a wide range of values.
Rules for creating class intervals
When setting up your class intervals, there are three fundamental rules that must always be followed to ensure your data is properly organized:
Critical Rules for Class Intervals:
- Every data value fits into exactly one interval
- Intervals do not overlap with each other
- There are no gaps between consecutive intervals
Violating any of these rules will result in an incorrect frequency table.
Choosing appropriate intervals
To create effective class intervals, follow these guidelines:
- Aim for 5 to 15 groups in total
- Choose interval widths that are easy to work with, such as 5 units, 10 units, or other convenient numbers
- Start your first interval with an appropriate value that makes sense for your data
Why start at natural boundaries?
It's better to use intervals like , , rather than , , because they start at natural boundary points. This makes the data easier to read and work with.
Components of a grouped frequency table
A grouped frequency table contains four essential columns:
Class: Lists the intervals or groups in ascending order from lowest to highest
Class centre: Shows the midpoint of each class interval, calculated by finding the middle value between the lower and upper boundaries
Tally: Records each data value using tally marks (grouped in fives for easy counting)
Frequency: Displays the total count of data values in each class
Calculating the class centre
The class centre is the middle value of each interval. This is calculated by adding the lower and upper boundaries and dividing by .
For example, for the class interval :
For the interval :
Worked example: constructing a grouped frequency table
Worked Example: Building a Grouped Frequency Table
Let's say twenty-six people recorded how many cups of coffee they drank in a week. The data collected is shown below:

Step 1: Create a table with four columns labeled: Class, Class centre, Tally, and Frequency
Step 2: Determine your class intervals. The data ranges from to , so using a class interval width of gives us classes: , , , , , ,
Step 3: Calculate the class centre for each interval by finding the midpoint
Step 4: Go through each data value and record a tally mark in the appropriate class interval
Step 5: Count the tally marks to determine the frequency for each class
Step 6: Add up all the frequencies to verify you've counted all data values (should equal )
The completed grouped frequency table looks like this:
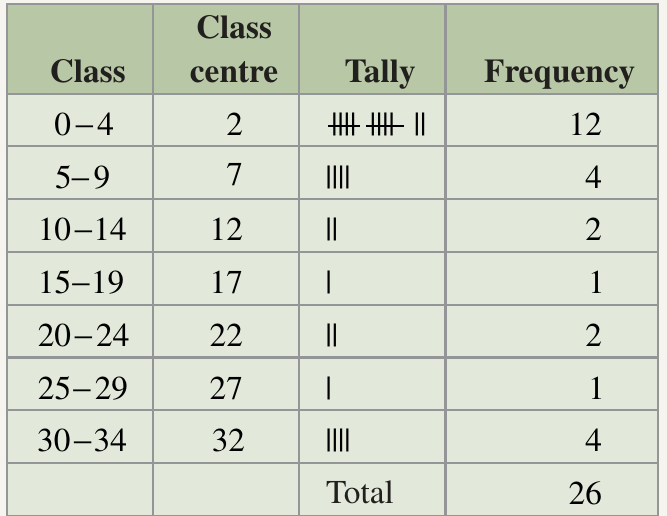
Analysis: Notice that most people ( out of ) drank between and cups of coffee during the week, while very few people fell into the middle ranges.
Cumulative frequency
What is cumulative frequency?
Cumulative frequency represents a running total of frequencies. For any particular score or class, the cumulative frequency is found by adding the frequency of that score to the frequencies of all scores below it.
In other words, cumulative frequency tells you "how many data values are at or below this point."
Understanding cumulative frequency:
Think of cumulative frequency as a way to answer questions like "How many students scored 20 or less?" or "How many days had a temperature of 22°C or lower?" It builds up progressively as you move through the data.
The key definition
Cumulative frequency = the frequency of the score plus the frequency of all the scores less than that score
This is the fundamental definition you must remember and apply when calculating cumulative frequencies.
How to calculate cumulative frequency
To build a cumulative frequency column:
Step 1: Start with the lowest score. Its cumulative frequency equals its frequency
Step 2: For the next score, add its frequency to the cumulative frequency of the previous score
Step 3: Continue this process, always adding the current frequency to the previous cumulative frequency
Step 4: The cumulative frequency for the highest score should equal the total number of data values
Worked example: calculating cumulative frequency
Worked Example: Computing Cumulative Frequencies
Consider a frequency table showing temperatures recorded over days:
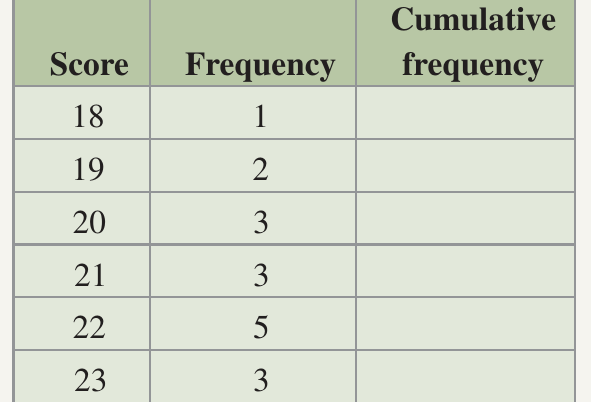
We need to complete the cumulative frequency column. Here's how:
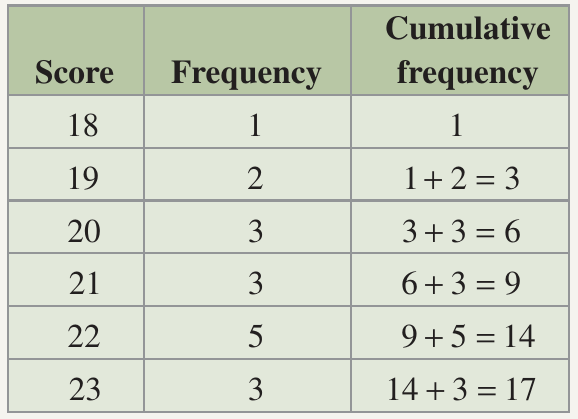
For score 18: Cumulative frequency = (this is the first score)
For score 19: Add the frequency of to the cumulative frequency of :
For score 20: Add the frequency of to the cumulative frequency of :
For score 21:
For score 22:
For score 23:
Verification: The final cumulative frequency of 17 matches the total number of days, confirming our calculations are correct.
Frequency graphs
Frequency histograms
A frequency histogram is a bar chart that displays grouped data. The horizontal axis shows the class intervals (or class centres), and the vertical axis shows the frequency. Each class is represented by a vertical rectangle (bar) whose height corresponds to the frequency for that class.
Key features of frequency histograms:
- Bars should be equal width, representing equal class intervals
- Bars should touch each other (no gaps) because the data is continuous
- The height of each bar represents the frequency
Common mistake to avoid:
Do NOT leave gaps between bars in a frequency histogram. Unlike regular bar charts where gaps are acceptable, frequency histograms must have touching bars because they represent continuous data.
Frequency polygons
A frequency polygon is a line graph that displays the same information as a frequency histogram. You create it by plotting points at the midpoint (top) of each histogram bar and connecting these points with straight lines.
Here's a visual comparison:
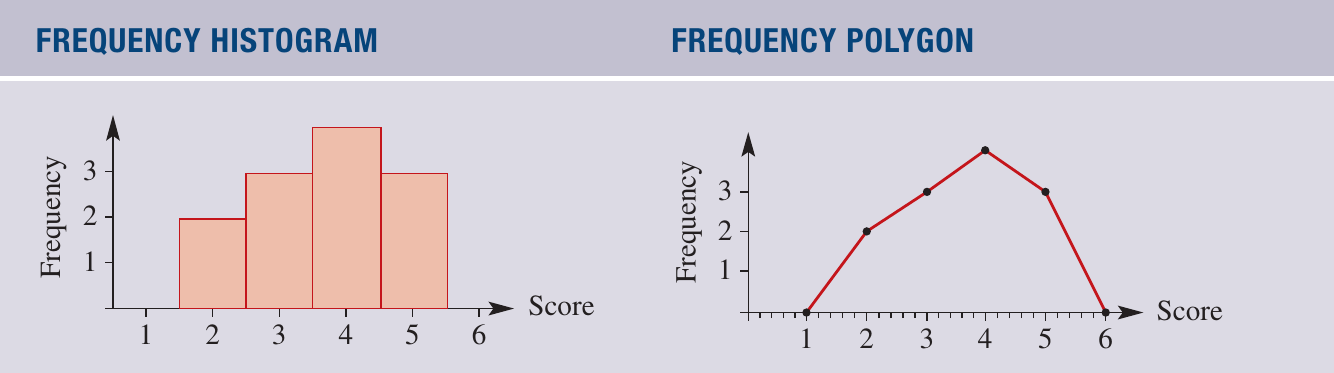
The histogram uses bars to show frequencies, while the polygon uses a connected line passing through the midpoints of where the bars would be.
Worked example: constructing frequency graphs
Worked Example: Drawing a Histogram and Frequency Polygon
The weights of students were recorded in this grouped frequency table:
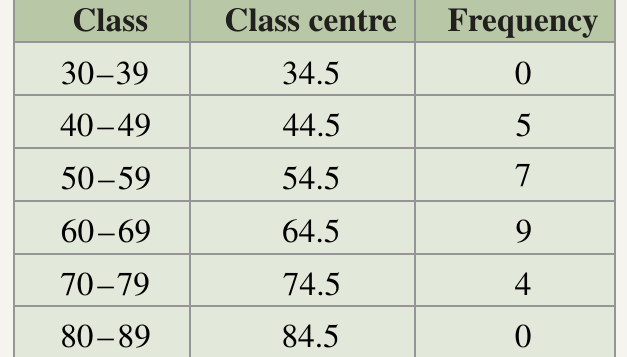
To construct a frequency histogram:
Step 1: Draw a horizontal axis showing each class interval (or class centre) equally spaced
Step 2: Draw a vertical axis with a scale that accommodates the highest frequency (in this case, up to )
Step 3: Label both axes clearly (horizontal: "Weight (kg)", vertical: "Number of students")
Step 4: Draw a rectangle for each class with height matching its frequency. Position each rectangle so the class centre is in the middle
To construct a frequency polygon:
Step 5: Instead of drawing rectangles, plot a point at the top centre of where each rectangle would be, at the height corresponding to the frequency
Step 6: Connect these points with straight lines
The resulting graphs look like this:
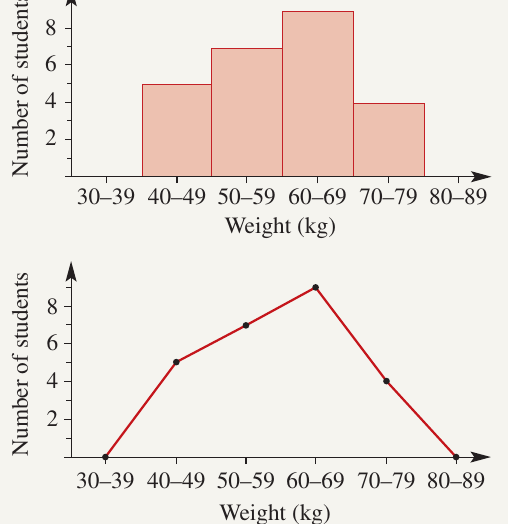
Analysis: Notice how both graphs display the same information - the polygon simply provides an alternative way to visualize the distribution.
Cumulative frequency graphs
Cumulative frequency histograms
A cumulative frequency histogram works similarly to a regular frequency histogram, but instead of showing individual frequencies, it displays cumulative frequencies on the vertical axis. The bars show running totals rather than individual counts.
Cumulative frequency polygons (ogives)
A cumulative frequency polygon, also called an ogive, is created by connecting the top right-hand corners of the rectangles in a cumulative frequency histogram. This creates a line graph that rises from left to right, showing how the cumulative total builds up.
Why are ogives useful?
Ogives are particularly powerful because they allow you to estimate the median and other percentiles directly from the graph without needing to look at the original data table.
Worked example: constructing cumulative frequency graphs
Worked Example: Creating Cumulative Frequency Graphs
Using the same student weight data, but now with cumulative frequencies calculated:
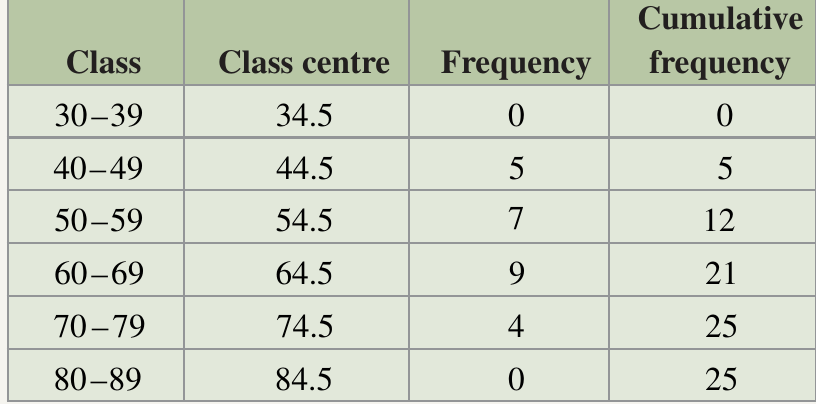
To construct the graphs:
Step 1: Draw a horizontal axis with equally spaced class centres
Step 2: Draw a vertical axis that goes up to the maximum cumulative frequency (in this case, )
Step 3: For the histogram, draw rectangles with heights matching the cumulative frequencies
Step 4: For the polygon (ogive), connect the top right-hand corners of each rectangle with straight lines
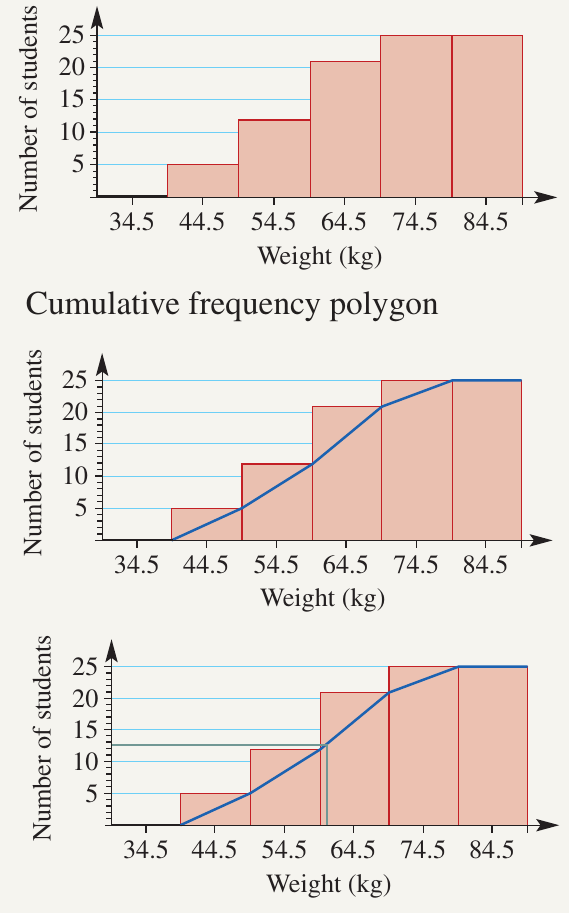
Using an ogive to estimate the median
One powerful use of a cumulative frequency polygon is estimating the median value. The median represents the middle value of your dataset when arranged in order.
Worked Example: Finding the Median from an Ogive
Step 1: Find the middle position. For students, the median is at position (or we can use )
Step 2: Draw a horizontal line from on the vertical axis until it intersects the ogive
Step 3: From the intersection point, draw a vertical line down to the horizontal axis
Step 4: Read the value where the vertical line meets the horizontal axis - this is your estimated median
Result: In this example, the median weight is approximately 60 kg. This means half the students weigh less than kg and half weigh more.
Exam tips
Essential Tips for Success:
- Always check that your class intervals cover all the data values with no gaps or overlaps
- When creating a grouped frequency table, verify that your frequencies add up to the total number of data values
- For cumulative frequency, always start with the lowest score and work upwards
- The final cumulative frequency must equal the total number of data values - use this as a check
- When drawing histograms, make sure bars touch each other (no gaps) for continuous data
- For ogives, remember to connect the top right-hand corners of the rectangles, not the centres
- To find the median from an ogive, locate the middle position ( or ) on the vertical axis
Remember!
Key Points to Remember:
- Grouped frequency tables organize large datasets into class intervals, making patterns easier to identify
- Class centres are found by calculating the midpoint of each interval
- Cumulative frequency is a running total calculated by adding each frequency to all previous frequencies
- Frequency histograms use touching bars to display grouped data
- Frequency polygons connect points at the tops of histogram bars with lines
- Ogives (cumulative frequency polygons) are excellent tools for estimating medians and other statistical measures
- Always verify your work: frequencies should sum to the total count, and the final cumulative frequency should equal the total number of data values