Outliers (HSC SSCE Mathematics Standard): Revision Notes
Outliers
What are outliers?
An outlier is a data value that sits unusually far from most other values in a dataset. These are scores that stand distinctly apart from the majority of the data and can significantly impact statistical analysis.
Identifying whether a particular value should be classified as an outlier can sometimes be challenging. To make this determination more objective, we use a mathematical rule based on the interquartile range.
Understanding outliers is crucial because they can distort your statistical analysis and lead to misleading conclusions. A single extreme value in a small dataset can dramatically change your results, which is why we need a systematic method to identify them.
Identifying outliers using the 1.5 IQR rule
To determine whether a value is an outlier, we apply the 1.5 IQR rule. This rule establishes clear boundaries beyond which any data value is considered an outlier.
The rule works by calculating two limits:
Lower limit:
Upper limit:
Any value that falls below the lower limit or above the upper limit is classified as an outlier.
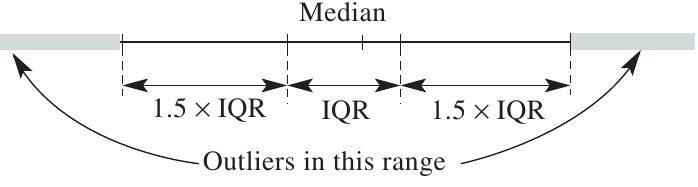
The diagram above illustrates how the 1.5 IQR rule works visually. The central box represents the interquartile range, with the median marked in the middle. The outlier regions extend 1.5 times the IQR beyond each end of the box.
Key formula:
An outlier is any value where: value or value
Remember: Subtract from Q₁ for the lower limit and add to Q₃ for the upper limit.
How outliers affect statistical measures
The impact of outliers varies depending on the size of your dataset and which measure of central tendency you're examining.
In large datasets:
Outliers typically have minimal effect on the mean, median, and mode. The sheer number of data values means that one or two extreme values are diluted by all the other data.
In small datasets:
The presence of an outlier can dramatically change your results:
- Mean: Large effect - the mean is highly sensitive to outliers because it includes every value in its calculation
- Median: Smaller effect - the median is more resistant to outliers as it only depends on the middle value(s)
- Mode: Usually no effect - the mode typically remains unchanged as outliers rarely appear frequently enough to become the most common value
Think of it this way: the mean moves most, the median moves moderately, and the mode stays the same. This makes the median a more reliable measure of central tendency when dealing with datasets that contain outliers.
When you have outliers in your dataset, consider using the median instead of the mean as your measure of central tendency. The median provides a more stable representation of the centre of your data because it's resistant to extreme values.
Worked example: Determining the effect of an outlier
Worked Example: Identifying and Measuring the Impact of an Outlier
Dataset for Task A:
Question (a): What is the outlier in Task A?
Solution:
Step 1: By examining the data, 91 appears to be an outlier as it is much larger than the other values.
Step 2: To verify this observation, we need to use the interquartile range method.
From the data:
- First quartile:
- Third quartile:
Step 3: Calculate the IQR:
Step 4: Calculate the lower limit:
Since there are no negative values in our dataset, no values fall below this limit.
Step 5: Calculate the upper limit:
Step 6: Identify values greater than the upper limit.
The value 91 is greater than 90, confirming that 91 is indeed an outlier.
Question (b): What is the effect of the outlier on the mean, median and mode?
Solution:
With outlier (30 values):
- Mean:
- Median: (average of 15th and 16th values, both )
- Mode: (appears three times, the highest frequency)
Without outlier (29 values):
- Mean:
- Median: (the 15th value)
- Mode: (still the most frequent value)
Interpretation:
The outlier of has increased the mean from 35.0 to 36.9, an increase of . This represents a significant change.
However, the outlier has had no effect on either the median or the mode. Both remain unchanged whether the outlier is included or removed.
This example demonstrates why the median is often preferred over the mean when outliers are present, as it provides a more stable measure of the centre of the data.
Remember!
Key Points to Remember:
- An outlier is a data value that lies unusually far from the majority of values in a dataset
- Use the 1.5 IQR rule to identify outliers: any value below or above is an outlier
- In small datasets, outliers significantly affect the mean, moderately affect the median, and rarely change the mode
- The median is more resistant to outliers than the mean, making it a better measure of central tendency when outliers are present
- Always check for outliers before analysing data, as they can distort your results and lead to incorrect conclusions