Direct Variation (HSC SSCE Mathematics Standard): Revision Notes
Direct Variation
What is direct variation?
Direct variation (also called direct proportion) happens when one quantity depends directly on another quantity. When one value increases or decreases, the other value changes at the same rate in the same direction.
Think about a simple example: your wage depends on how many hours you work. If you work more hours, you earn more money. If you work fewer hours, you earn less money. The relationship between hours worked and wage is a direct variation.
Real-World Connection: Hourly Wages
In the wage example, if you earn $20 per hour:
- Work 5 hours → earn $100
- Work 10 hours → earn $200
- Work 15 hours → earn $300
Notice how doubling your hours doubles your wage. This is the essence of direct variation!
Key characteristics of direct variation:
- Both quantities change in the same direction (both increase or both decrease)
- The rate of change stays constant
- When graphed, direct variation creates a straight line through the origin
The constant of variation
Every direct variation relationship includes a constant of variation, represented by the letter . This constant tells us the rate at which the quantities change together.
In the wage example above, if you earn $20 per hour, then . This means:
- For every additional hour worked, you earn an extra $20
- The constant stays the same no matter how many hours you work
The constant of variation is the multiplier that connects the two variables. Finding the value of is an essential step in solving direct variation problems.
Understanding the Constant
The constant of variation () is NOT just any number—it has meaning! It represents the actual rate of change:
- In hourly wages: is the dollars per hour
- In speed problems: is the distance per unit of time
- In currency conversion: is the exchange rate
Always think about what represents in your specific problem!
The direct variation formula
When a quantity varies directly with quantity , we can write this relationship as an equation:
Where:
- is the dependent variable (the quantity that depends on the other)
- is the independent variable (the quantity that controls the relationship)
- is the constant of variation (the rate of change)
This formula tells us that equals times . Once we know the value of , we can calculate for any value of , or calculate for any value of .
Formula Flexibility
The direct variation formula can be rearranged depending on what you need to find:
- To find :
- To find :
- To find :
All three forms represent the same relationship!
Solving direct variation problems
Follow these three steps to solve any direct variation problem:
Step 1: Write an equation relating the two variables
Use the formula , replacing and with the actual variables from your problem.
Step 2: Find the constant of variation
Substitute the given values for and into your equation, then solve for .
Step 3: Write the complete equation and solve
Replace in your equation with the value you found, then substitute the new given value to answer the question.
Worked Example: Photocopier Costs
Problem: The cost of a photocopier (, in dollars) varies directly with its speed (, in pages per minute). A photocopier with a speed of 50 pages per minute costs $700.
a) What is the constant of variation ()?
b) Write an equation connecting and .
c) How much does a photocopier with a speed of 60 pages per minute cost?
Solution:
Part a) Finding the constant of variation:
-
Cost is directly proportional to speed, so we write:
-
We know that when ,
-
Substitute these values into the formula:
-
Solve for :
Part b) Writing the equation:
-
Now that we know , we can write the complete equation:
Part c) Finding the cost for 60 pages per minute:
-
Use the equation with :
-
Answer: A photocopier with a speed of 60 pages per minute costs $840.
Using graphs with direct variation
Direct variation relationships can be shown on graphs. These graphs are always straight lines that pass through the origin (0, 0). We can use these graphs to:
- Convert between different quantities
- Find values that aren't in a table
- Visualise the relationship between variables
Why Through the Origin?
Direct variation graphs always pass through (0, 0) because when one quantity is zero, the other must also be zero. Think about it: if you work 0 hours, you earn $0. If you travel at any speed for 0 time, you travel 0 distance. This is a key feature that distinguishes direct variation from other linear relationships!
Worked example: Currency conversion
Worked Example: Currency Conversion
Problem: The graph below shows the conversion between Australian dollars and New Zealand dollars.
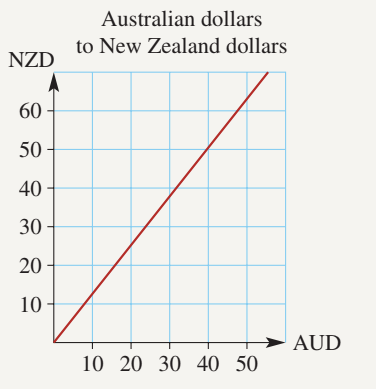
Use the graph to convert:
a) 40 Australian dollars to New Zealand dollars
b) 25 NZD to AUD

Solution:
To read values from a conversion graph:
- Find the known value on the appropriate axis
- Draw a vertical or horizontal line to the graph
- Draw a line from the graph to the other axis
- Read the converted value
Part a) Converting 40 AUD to NZD:
- Find 40 on the horizontal axis (AUD)
- Read across to the graph line
- Read the value on the vertical axis (NZD)
- Answer: 40 AUD = 50 NZD
Part b) Converting 25 NZD to AUD:
- Find 25 on the vertical axis (NZD)
- Read across to the graph line
- Read the value on the horizontal axis (AUD)
- Answer: 25 NZD = 20 AUD
Worked example: Creating a graph from a table
Worked Example: Creating a Graph from a Table
Problem: The table below shows the cost of postage () as a function of the weight of the parcel ().
| Weight () kg | 1 | 2 | 3 | 4 | 5 |
|---|---|---|---|---|---|
| Cost () $ | 1.2 | 2.4 | 3.6 | 4.8 | 6.0 |
a) Draw a graph of cost () against the weight of the parcel ()
b) Use the graph to determine the cost of a parcel if the weight is 2.5 kg
Solution:
Part a) Drawing the graph:
- Set up a number plane with weight () on the horizontal axis and cost () on the vertical axis
- Plot the points from the table:
- (1, 1.2)
- (2, 2.4)
- (3, 3.6)
- (4, 4.8)
- (5, 6.0)
- Join the points with a straight line
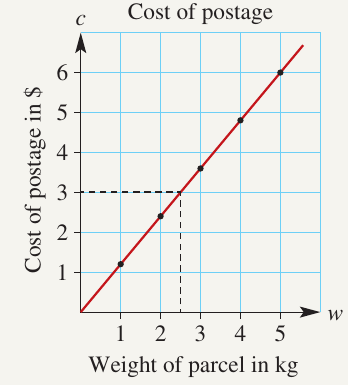
- Locate 2.5 kg on the horizontal axis
- Draw a vertical line upward until it meets the graph
- From that point, draw a horizontal line across to the vertical axis
- Read the cost value
- Answer: A parcel weighing 2.5 kg would cost $3
Exam Tip: Accurate Graph Reading
When reading values from a graph, always use a ruler to draw straight lines. This helps you:
- Read accurate values from the axes
- Show clear working in your solution
- Avoid making careless errors
Examiners look for neat, precise work—using a ruler demonstrates good mathematical practice!
Remember!
Key Points to Remember:
-
Direct variation occurs when two quantities change at the same rate in the same direction
-
The constant of variation () represents the rate of change between the two quantities
-
The formula for direct variation is , where is the constant of variation
-
To solve direct variation problems: (1) write the equation, (2) find using given values, (3) use the complete equation to answer the question
-
Graphs of direct variation are always straight lines passing through the origin