Linear Models (HSC SSCE Mathematics Standard): Revision Notes
Linear Models
What is a linear model?
A linear model is a mathematical way to represent real-world situations using a straight-line equation. When we create a linear model, we're describing a practical situation using a linear function. This allows us to make predictions, understand relationships, and solve problems mathematically.
Linear models are particularly useful because many everyday situations involve constant rates of change. For example, when a catering company charges a fixed base fee plus an amount per person, or when water flows into a tank at a steady rate, these situations can be modelled using straight-line graphs.
Linear models are everywhere in daily life! They help us understand costs, speeds, conversions, and many other practical situations where there's a steady rate of change.
The gradient-intercept form
The most common way to write a linear model is using the gradient-intercept form:
where:
- is the dependent variable (the value we're calculating)
- is the independent variable (the value we know or choose)
- is the gradient (the rate of change)
- is the -intercept (the starting value when )
Components of a linear model
Every linear model has two key components that tell us important information about the situation.
The gradient (m)
The gradient represents the rate of change. It tells us how much changes for every unit increase in . In practical situations, the gradient often represents:
- A cost per item
- A speed or velocity
- A rate of flow
- A rate of change over time
To calculate the gradient using two points and :
Remember "Rise over Run": The gradient is calculated by dividing the vertical change (rise) by the horizontal change (run) between any two points on the line.
The intercept (b)
The intercept represents the starting value when . In practical situations, the intercept often represents:
- A base fee or fixed cost
- An initial amount
- A starting value before any changes occur
Understanding the gradient and intercept is crucial! The gradient tells you the rate, while the intercept tells you the starting point. Together, they completely describe the linear relationship.
Example: catering costs
A catering company charges a base amount of $100 plus a rate of $25 per guest. We can model this situation using a linear equation.
Let be the cost of the event (in dollars) and be the number of guests. The equation becomes:
In this model:
- The gradient is 25, which represents the rate per guest ($25 per person)
- The -intercept is 100, which represents the base amount ($100 fixed cost)
- The number of guests must be greater than zero and a whole number
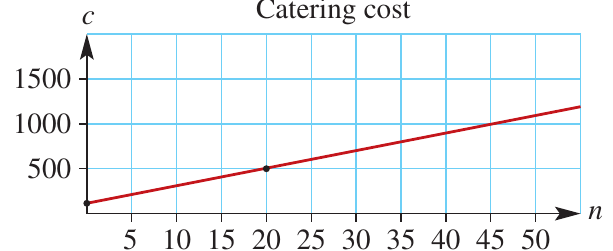
The graph shows how the cost increases linearly with the number of guests. The steepness of the line is determined by the gradient ($25 per guest), and the line crosses the vertical axis at $100 (the base amount).
Reading values from linear graphs
Linear graphs are useful tools for making conversions and reading values. You can read information from a graph by tracing horizontal and vertical lines from known values to find unknown values.
When reading from graphs, always trace lines carefully and read values at the grid intersections for accuracy. You can read in both directions—from the horizontal axis to vertical, or from vertical to horizontal.
Worked example: currency conversion
Currency exchange rates can be represented using linear graphs, allowing us to convert between different currencies quickly.

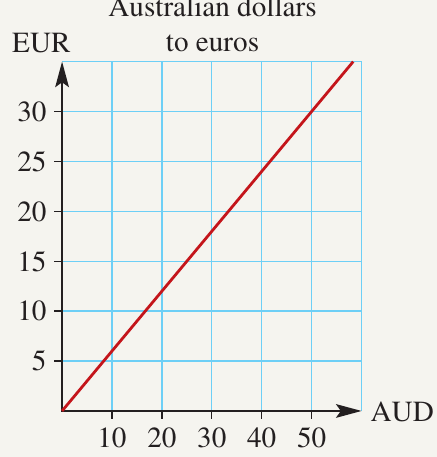
The graph below converts Australian dollars (AUD) to euros (EUR).
Worked Example: Currency Conversion
Part a: Convert 50 Australian dollars to euros
To solve this:
- Locate 50 on the AUD axis (horizontal)
- Draw a vertical line up to meet the red line
- Draw a horizontal line across to the EUR axis (vertical)
- Read the value: 30 euros
Answer: 50 Australian dollars = 30 euros
Part b: Convert 15 euros to Australian dollars
To solve this:
- Locate 15 on the EUR axis (vertical)
- Draw a horizontal line across to meet the red line
- Draw a vertical line down to the AUD axis (horizontal)
- Read the value: 25 Australian dollars
Answer: 15 euros = 25 Australian dollars
Finding equations from graphs
When you're given a linear graph, you can find its equation by identifying key information from the graph and using the gradient-intercept form.
Worked example: water tank problem
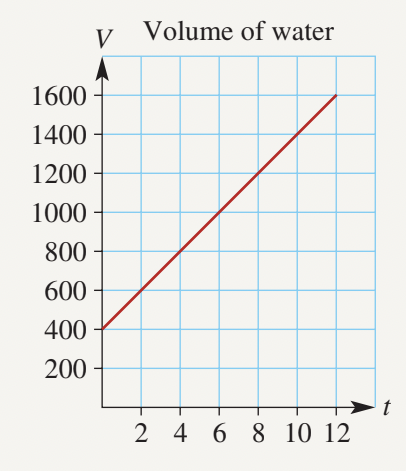
Water is pumped into a partially full tank. The graph shows the volume of water (in litres) after minutes.
Worked Example: Water Tank Problem
Part a: How much water is in the tank at the start?
At the start, . Reading from the graph when , we find .
Answer: 400 L
Part b: How much water is in the tank after 10 minutes?
Reading from the graph when , we find .
Answer: 1400 L
Part c: The tank holds 1600 L. How long does it take to fill?
Reading from the graph when , we find .
Answer: 12 minutes
Part d: Find the equation of the straight line in terms of V and t
To find the equation, we need to determine the gradient and intercept.
Step 1: Choose two suitable points from the graph
We can use and .
Step 2: Calculate the gradient using the gradient formula
Step 3: Determine the vertical intercept
When , , so .
Step 4: Write the equation in gradient-intercept form
Using , we substitute the appropriate variables ( for , for ):
Answer:
Part e: Use the equation to calculate the volume of water in the tank after 7 minutes
Substitute into the equation:
We can verify this answer by checking the graph at .
Answer: 1100 L
Part f: How many litres are pumped into the tank each minute?
The rate at which water is pumped into the tank is represented by the gradient of the graph. From part d, we found that .
Answer: 100 L/min
Exam Tip
When finding equations from graphs, always:
- Identify at least two clear points on the line
- Use points where the line crosses grid intersections for accuracy
- Show your working for gradient calculations
- Check your answer makes sense in the context
Remember!
Key Points to Remember:
- A linear model uses a straight-line equation to represent a real-world situation mathematically.
- The gradient-intercept form is , where is the gradient (rate of change) and is the intercept (starting value).
- The gradient tells you the rate of change—how much one variable changes for each unit change in the other variable.
- The intercept tells you the starting value when the independent variable equals zero.
- You can read values from linear graphs by tracing horizontal and vertical lines between the axes and the line.
- To find an equation from a graph, calculate the gradient using two points and identify the intercept where the line crosses the vertical axis.