Drawing a Network Diagram (HSC SSCE Mathematics Standard): Revision Notes
Drawing a Network Diagram
Network diagrams are visual tools that help us understand connections between different objects or people in everyday life. Think about how towns connect via roads, how computers link to the internet, or how people interact on social media. All these relationships can be represented using network diagrams. In mathematics, we call these visual representations graphs.
When creating a network diagram, we use two main components:
- Vertices (singular: vertex): These are the dots or points that represent the objects or people
- Edges: These are the lines that connect the vertices and show relationships between them
Connected graphs
A network diagram can be either connected or not connected, depending on whether you can travel from any vertex to any other vertex along the edges.
What is a connected graph?
A graph is connected when every vertex can be reached from every other vertex by travelling along the edges. This means there's always a path that links any two vertices in the graph.
Formal Definition: Connected Graph
A graph is connected if every vertex in the graph is accessible from every other vertex in the graph along a path formed by the edges of the graph.
Examples of connected graphs
Let's look at some graphs that are connected:
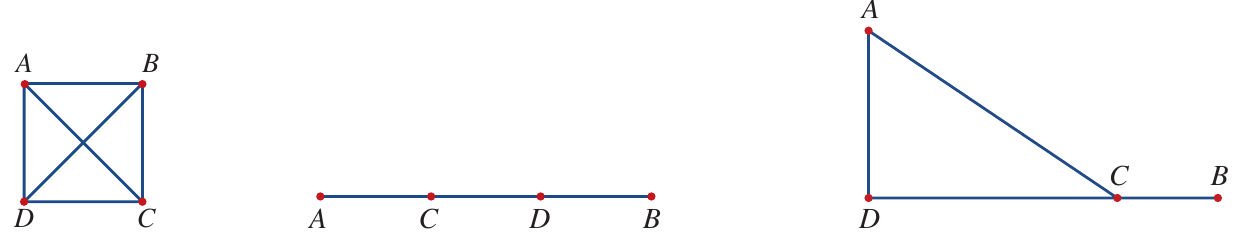
In each of these graphs, you can start at any vertex (for example, vertex ) and find a path along the edges to reach every other vertex. Even though they look different, they're all connected because no vertex is isolated or unreachable.
Examples of not connected graphs
Now let's examine some graphs that are not connected:
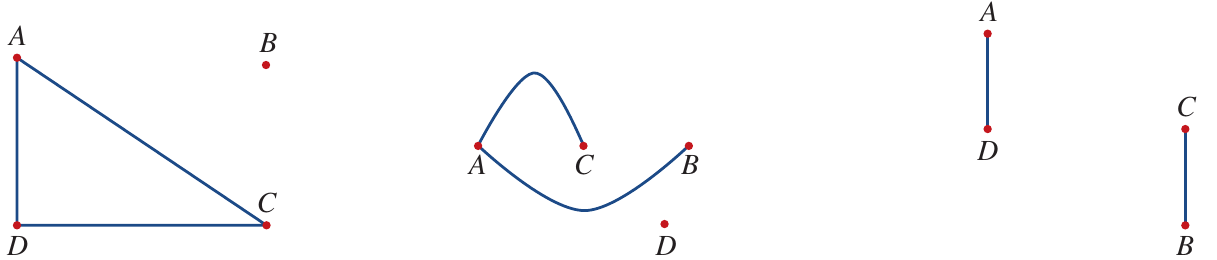
These graphs are not connected because there's at least one vertex that cannot be reached from other vertices. For instance, in the first graph, vertex is completely isolated, so you cannot travel from vertex to vertex along any edges.
Exam Tip: Testing for Connectivity
To check if a graph is connected, pick any vertex and see if you can trace a path along edges to reach all other vertices. If you can't reach even one vertex, the graph is not connected.
Isomorphic graphs
Sometimes two graphs can look completely different but actually contain the same information. When this happens, we say these graphs are isomorphic or equivalent.
Understanding isomorphism
Think of isomorphic graphs like different drawings of the same house floor plan. The rooms and doors are the same, but the drawing might be rotated or stretched. Here's what makes graphs isomorphic:
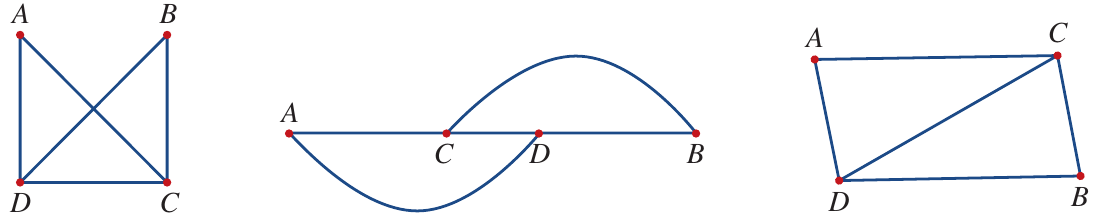
These three graphs look quite different, but they're all isomorphic because:
- They each have vertices
- They each have edges
- The connections between vertices are identical (vertex connects to and , vertex connects to and , and vertex connects to )
Conditions for isomorphic graphs
Conditions for Isomorphism
Two graphs are isomorphic (equivalent) if:
- They have the same numbers of edges and vertices
- Corresponding vertices have the same degree (the degree of a vertex is the number of edges connected to it)
- The edges connect to the same vertices
Critical Point
Just having the same number of vertices and edges isn't enough. The connections must also match up exactly.
Worked example: Identifying an isomorphic graph
Worked Example 3: Identifying Non-Isomorphic Graphs
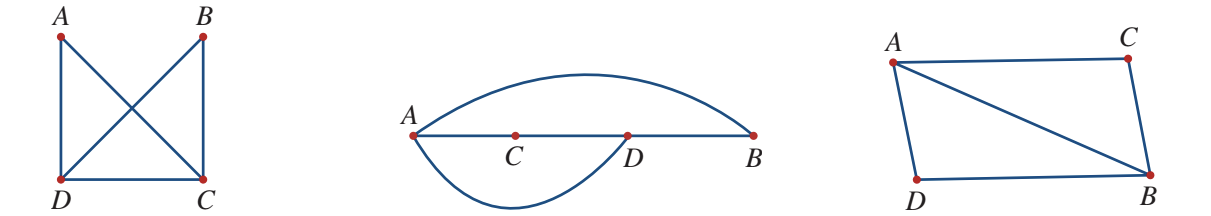
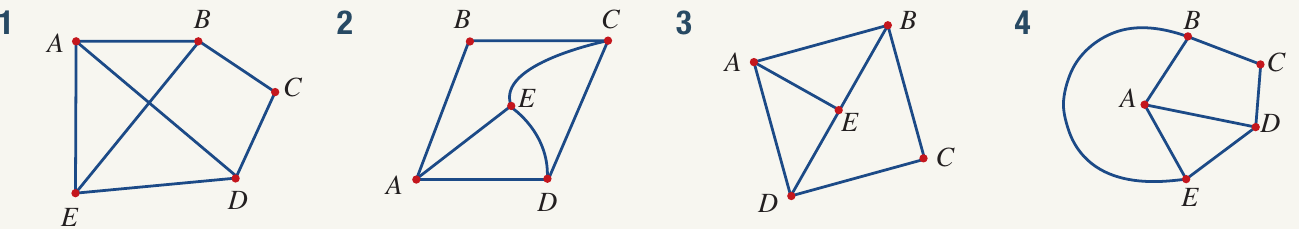
Question: Which of the following graphs is not isomorphic to the other three graphs?
Solution:
Step 1: Check that each graph has the same number of vertices and edges
All four graphs have:
- vertices (labelled , , , , )
- edges
Step 2: Check that corresponding vertices have the same degree
Let's examine the degree of each vertex:
- In Graph 2: vertex has degree and vertex has degree
- In all other graphs: vertex has degree and vertex has degree
This is already different, so Graph 2 cannot be isomorphic to the others.
Step 3: Check that edges connect to the same vertices
In graphs 1, 3, and 4, the edges are:
- –, –, –, –, –, –, –
In Graph 2:
- Edge – is missing
- Edge – is present (but doesn't appear in the other graphs)
Answer: Graph 2 is not isomorphic to the other three graphs.
Drawing network diagrams from maps
Network diagrams are particularly useful for representing real-world situations like road networks, flight routes, or communication systems. The key is understanding what should be represented as vertices and what should be edges.
Worked example: Australian highways
Worked Example 4: Converting a Map to a Network Diagram
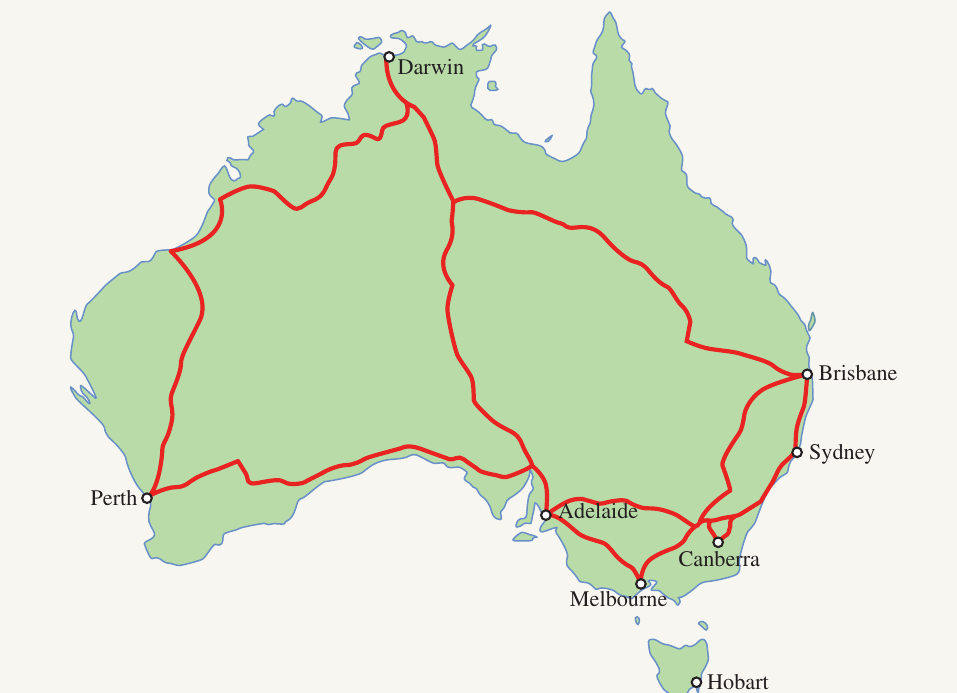
Question: The map below shows the main highways between the capital cities of Australia. Construct a network diagram of these highway connections. Let each capital city be a vertex and each highway route be an edge.
Step 1: Identify the vertices
The vertices will be the eight capital cities:
- Brisbane
- Sydney
- Canberra
- Melbourne
- Hobart
- Adelaide
- Perth
- Darwin
Step 2: Identify the edges
Highway routes connect the cities, with the exception of Hobart (which is on an island).
Step 3: Draw the vertices
Start by drawing a dot for each capital city.
Step 4: Label the vertices
Label each dot with the name of the capital city.
Step 5: Draw the edges
Draw a line between two vertices if there's a highway route connecting those cities.
Step 6: Complete the diagram
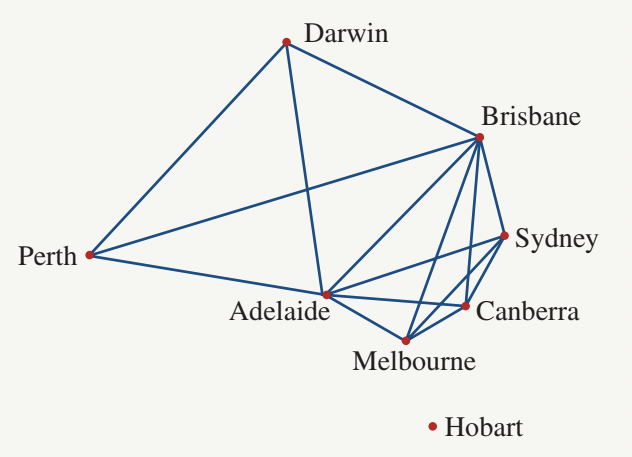
Important Notes About the Diagram
- The network diagram is not connected because Hobart has no highway linking it to any other city
- The proportions don't need to match the real-life distances or positions
- What matters is showing which cities are connected, not their exact geographic locations
Drawing network diagrams from tables
Tables are another common way to represent relationships, and we can convert this information into network diagrams. The table structure naturally shows which objects or people are related to each other.
Worked example: Student problem-solving
Worked Example 5: Converting a Table to a Network Diagram
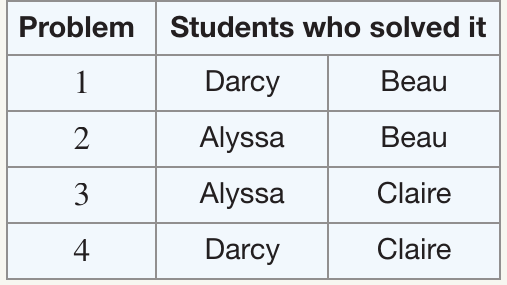
Question: A group of four students worked in pairs on four different problems. The table shows which students solved each problem together. Answer the following questions:
a) What will be the vertices of the network diagram?
b) What will be an edge in the network diagram?
c) Draw a network diagram to represent the information in the table.
d) Draw an isomorphic graph of the network diagram.
e) Which students have not been able to solve a problem together?

Solution:
a) Identifying vertices
Vertices are the main objects in the network. In this situation, each student will be a vertex.
Answer: The vertices are Alyssa, Beau, Claire, and Darcy.
b) Identifying edges
Edges show connections or relationships. In this problem, edges are drawn when two students have worked together to solve a problem.
Answer: An edge connects two students if they have worked together to solve a problem.
c) Drawing the network diagram
To construct the diagram:
- Draw a dot for each student (vertex)
- Label each dot with the student's name
- Draw a line between two students if they worked together on any problem
From the table:
- Darcy and Beau worked together (Problem 1)
- Alyssa and Beau worked together (Problem 2)
- Alyssa and Claire worked together (Problem 3)
- Darcy and Claire worked together (Problem 4)
The network diagram is connected because you can trace a path along the edges to reach every vertex from any other vertex.
d) Drawing an isomorphic graph
An isomorphic graph must have:
- The same number of vertices ()
- The same number of edges ()
- The same connections between vertices
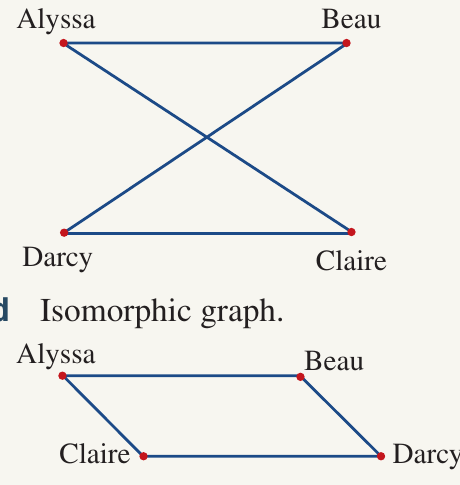
Both diagrams show the same relationships, just arranged differently. They're isomorphic because the connections are identical.
e) Finding students who haven't worked together
Look for pairs of vertices that don't have an edge connecting them.
Answer: Alyssa and Darcy have not solved a problem together. Beau and Claire have not solved a problem together.
Weighted graphs
So far, we've looked at graphs where edges simply show that a connection exists. But often we need to include additional numerical information about these connections.
What is a weighted graph?
A weighted graph is a network diagram where each edge has a number (called a weight) attached to it. This weight represents some numerical value such as:
- Distance between locations
- Travel time between places
- Cost of travelling a route
- Capacity of a connection
Understanding weighted edges
When an edge represents a road between two towns, we might want to know:
- How long is the road?
- How much time does it take to travel?
- What's the cost of using this route?
We add this information by writing a number next to each edge. This number is called a weighted edge or weight.
Formal Definition: Weighted Graph
A weighted graph is a network diagram that has weighted edges; i.e. edges with numbers assigned that imply some numerical value such as cost, distance or time.
Example of a weighted graph
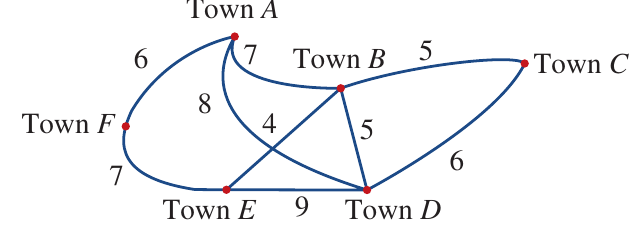
This weighted graph shows:
- Vertices representing towns (, , , , , )
- Edges representing roads between towns
- Weights showing distances along each road
A common question with weighted graphs is: "What is the shortest distance between certain towns?"
For directly connected towns (like Town to Town ), we can read the distance directly from the edge. But for towns that aren't directly connected (like Town to Town ), we need to find a path through other towns and add up the weights.
Worked example: Converting a weighted graph to a table
Worked Example 6: Creating a Table from a Weighted Graph
Question: Construct a table from the weighted graph shown below:
Solution:
Step 1: Create table headings
The vertices (, , , , ) become the headings for both rows and columns.
Step 2: Enter weighted edges
When there's a weighted edge between two vertices, enter that value in the corresponding cell. For example, since and are connected by an edge with weight , enter in both the cell and the cell.
Step 3: Complete the table
Repeat for all weighted edges. Use a dash (–) when there's no direct edge between vertices.
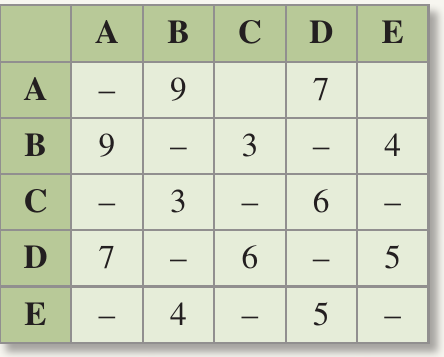
Understanding Table Symmetry
The table is symmetrical because the graph is undirected (you can travel both ways along each edge). The value for is the same as .
Worked example: Drawing a weighted graph from a table
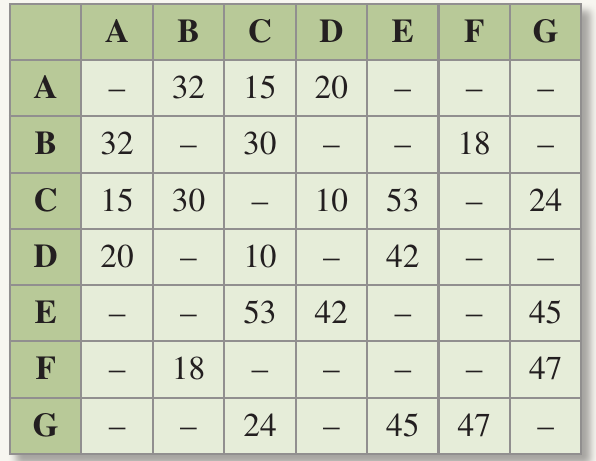
Worked Example 7: Creating a Weighted Graph from a Table
Question: A network diagram is to be constructed from the table below.
a) What will be the vertices of the network diagram?
b) What will be the values of the weighted edges?
c) Draw a weighted graph to represent the information in the table.
d) What is the total of the weighted path from to via , , and ?
Solution:
a) Identifying vertices
Vertices are the headings of the rows and columns in the table.
Answer: The vertices are , , , , , , and .
b) Identifying weighted edges
Edges are represented by the numerical values in the table cells. Since the table is symmetrical, each edge appears twice (for example, and represent the same edge).
Answer: The weighted edges are:
c) Drawing the weighted graph
To construct the diagram:
- Draw a dot for each vertex (letter)
- Label each vertex
- Draw a line between two vertices if there's a value in the table
- Write the weight next to each edge
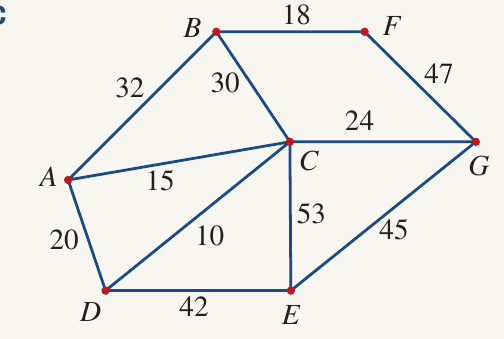
d) Calculating the weighted path
To find the total distance from to via , , and , add up the weights along this path:
- From to : weight
- From to : weight
- From to : weight
- From to : weight
Total:
Answer: The total weighted path is .
Flexibility in Graph Layout
Your diagram might look slightly different (rotated or reflected) from the one shown, and that's perfectly fine! As long as the vertices and weighted connections are correct, it's the same graph.
Key Points to Remember:
-
A connected graph allows you to reach any vertex from any other vertex by travelling along edges. If even one vertex is isolated, the graph is not connected.
-
Isomorphic graphs look different but represent the same information. They must have the same number of vertices and edges, with corresponding vertices having the same degree and identical connections.
-
Weighted graphs include numerical values (weights) on edges to represent distances, times, costs, or other quantities. These weights help solve real-world problems like finding shortest routes.
-
When converting between tables and graphs, remember that vertices correspond to row/column headings, and weighted edges correspond to numerical values in the table cells.
-
The visual arrangement of a graph doesn't matter as much as the connections. Different arrangements of the same graph (rotations, reflections, or different layouts) are still considered equivalent if they maintain the same relationships between vertices.