Using Z-Scores to Compare Data (HSC SSCE Mathematics Standard): Revision Notes
Using Z-Scores to Compare Data
What are z-scores used for?
When comparing results from two different tests or datasets, it can be challenging to make meaningful comparisons. This is because different datasets often have different means and standard deviations. For instance, if one test has an average score of 60 with a standard deviation of 10, and another has an average of 75 with a standard deviation of 5, how can we fairly compare someone's performance on both tests?
The z-score provides a solution by converting scores into a standardized form. It tells us how many standard deviations a particular value is above or below the mean. This makes it possible to compare results from completely different datasets on a level playing field.
Why standardization matters:
Without z-scores, comparing raw scores across different tests would be like comparing apples to oranges. A score of 80 might be excellent on one test but mediocre on another, depending on how difficult each test is and how other students performed. Z-scores solve this by putting all scores on the same scale.
Understanding z-scores
The z-score formula is:
Where:
- = the z-score (standardized score)
- = the individual data value
- = the mean of the dataset
- = the standard deviation of the dataset
Key principles for using z-scores to compare data
Two critical rules for comparing z-scores:
Rule 1 - Context matters: Always read the question carefully to determine whether a higher or lower z-score represents better performance. For example:
- In test scores, higher is usually better (higher z-score = better performance)
- In race times, lower is better (more negative z-score = better performance)
Rule 2 - Distance from the mean: The larger the absolute value of the z-score (ignoring whether it's positive or negative), the further the result is from the average. A z-score of 3 or -3 is further from the mean than a z-score of 1.5 or -1.5.
Worked examples
Worked Example 1: Comparing swimming times
David wants to compare his performance in two swimming events: freestyle and butterfly. He needs to determine in which event he performed better relative to his club members.
Freestyle: David swam 35 seconds. The club average was 43 seconds with a standard deviation of 4 seconds.
Butterfly: David swam 37 seconds. The club average was 46 seconds with a standard deviation of 3 seconds.

Solution:
Step 1: Calculate the z-score for freestyle
Step 2: Calculate the z-score for butterfly
Step 3: Compare the results
In swimming, lower times are better. David's butterfly z-score is , which means he was 3 standard deviations below the mean (faster than average). His freestyle z-score is , meaning he was 2 standard deviations below the mean.
Conclusion: David performed better in butterfly because his z-score of -3 is further from the mean than his freestyle z-score of -2. His butterfly time was relatively faster compared to other club members.
Worked Example 2: Comparing exam scores
Kayla took two exams: Algebra and Finance. The statistics for both exams are shown below:
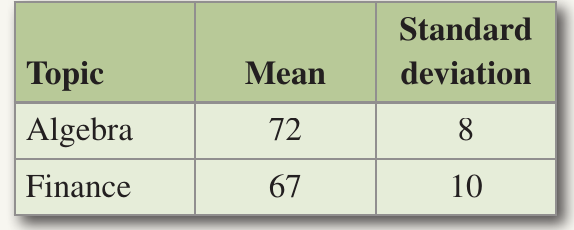
Kayla scored 76 in Algebra and 74 in Finance. Let's determine in which subject she performed better relative to other students.
Solution:
Part a: Calculate Kayla's z-score for Algebra
Part b: Calculate Kayla's z-score for Finance
Part c: Compare the results
For exam scores, higher marks are better. Kayla's Finance z-score of 0.7 means she scored 0.7 standard deviations above the mean. Her Algebra z-score of 0.5 means she scored 0.5 standard deviations above the mean.
Conclusion: Kayla performed better in Finance relative to other students. Her z-score of 0.7 for Finance shows she did better compared to others who took that exam than her z-score of 0.5 for Algebra.
Worked Example 3: Comparing test percentages
Xavier scored 65% in his English test (mean = 52, standard deviation = 9.5) and 61% in Mathematics (mean = 47, standard deviation = 7.5). In which subject did he perform better?
Solution:
Step 1: Calculate the z-score for English
Step 2: Calculate the z-score for Mathematics
Step 3: Compare the results
Both z-scores are positive, meaning Xavier scored above average in both subjects. However, his Mathematics z-score of approximately 1.87 is higher than his English z-score of approximately 1.37.
Conclusion: Xavier performed better in Mathematics. Even though his raw percentage was lower in Maths (61% vs 65%), his performance relative to other students was stronger, as shown by his higher z-score.
Exam tips
Tips for success in exam questions:
- Always write down the formula before substituting values
- Show all working steps clearly
- Round z-scores to appropriate decimal places (usually 1 or 2 decimal places)
- Remember to justify your answer by comparing z-scores in context
- Check whether higher or lower values represent better performance before making your final conclusion
- Pay attention to the sign of the z-score: positive means above average, negative means below average
Remember!
Key Points to Remember:
- Z-scores standardize data by showing how many standard deviations a value is from the mean
- The formula is:
- Larger absolute z-scores (ignoring the positive or negative sign) indicate values that are further from the mean
- Context is crucial: Determine whether higher or lower z-scores represent better performance based on the situation
- Z-scores enable fair comparisons between datasets with different means and standard deviations