Power (HSC SSCE Physics): Revision Notes
Power
Introduction to power
Imagine two cranes that can both lift a tonne block of concrete to the top of a building. The first crane completes this task in minute, while the second crane takes minutes. Although both cranes do the same amount of work on the load, they take different amounts of time. The crane that completes the task faster is more powerful.
This comparison shows us that power is not just about how much work is done, but about how quickly that work is completed. Time is a crucial factor in determining power!
What is power?
Power is the rate at which work is done. Since work represents the energy transferred by a force, we can also define power as the rate at which energy is transferred or transformed from one form to another.
The mathematical definition of power is:
Where:
- is power
- is the work done
- is the change in energy
- is the time interval
Units of power
The SI unit of power is the watt (W), named after James Watt. One watt is equivalent to:
This means that one watt represents the transfer of one joule of energy per second.
Understanding the Watt:
- A light globe transforms of electrical energy into light and heat every second
- A crane motor increases the gravitational potential energy of a load by every second (assuming efficiency)
Notice how larger values of power mean more energy is being transferred in the same amount of time!
Energy and power relationships
We can rearrange the power equation to find the energy transferred or transformed in a process:
This equation tells us that the total energy change equals the power multiplied by the time interval over which the power is applied.
Graphical representations
The relationship between power, energy, and time can be visualized using graphs.
Understanding Energy and Power Graphs:
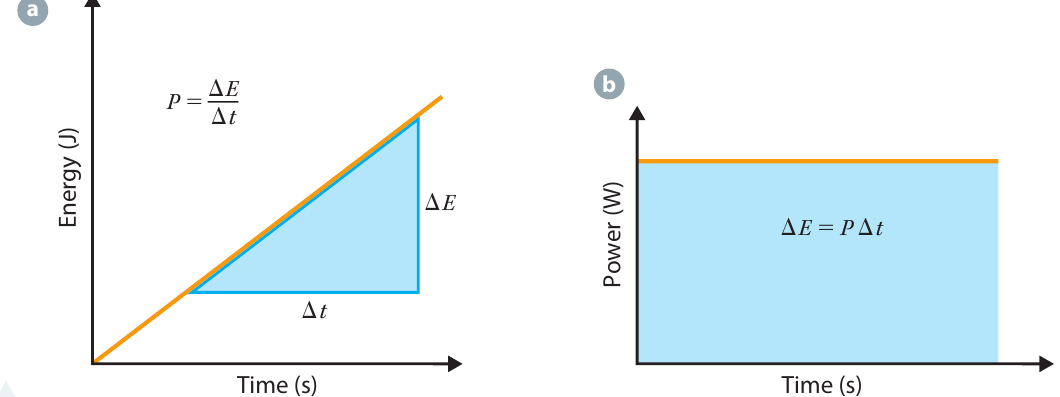
Energy-time graph (left): When you plot energy against time, the gradient (steepness) of the line at any moment represents the power. A steeper line indicates higher power.
Power-time graph (right): When you plot power against time, the area under the line represents the total energy transferred. The shaded rectangle shows this relationship.
Relating power to force and velocity
We can derive another useful expression for power by connecting it to force and velocity. Starting with the work equation:
Substituting this into the power equation:
Therefore:
This equation shows that the power (rate of energy transfer) equals the force applied multiplied by the velocity of the object, taking into account the angle between the force and velocity vectors. When the force and velocity are in the same direction, , so .
This is a powerful relationship because it connects dynamics (force) with kinematics (velocity) through the concept of power!
Worked example: crane lifting a concrete block
Worked Example: Calculating Crane Power
Let's apply these concepts to calculate the power used by a crane.
Problem: A crane takes minute to lift a block of concrete vertically upwards through a height of at constant speed. Calculate the power used by the crane to lift the block.
Solution:
Given data:
- Mass:
- Height:
- Time:
Step 1: Choose the appropriate formula for power:
Step 2: Since the block moves at constant speed, the net force is zero (Newton's second law). Therefore, the upward force applied by the crane equals the downward gravitational force:
Step 3: Calculate the gravitational force:
Step 4: Calculate the velocity:
Step 5: Substitute into the power equation:
Step 6: Calculate:
Answer: P = 1600 W or 1.6 kW (to 2 significant figures)
Note: If the crane took minutes instead, the power would be:
The longer time results in lower power, even though the same amount of work is done.
Factors affecting power in vehicles
The top speed of a car is determined by several factors, with engine power being a key consideration. Understanding the forces that oppose motion helps explain why more power is needed to maintain higher speeds.
Air resistance
As a car's speed increases, air resistance increases significantly. This force does negative work on the car, removing energy from the system. To maintain a constant speed, the engine must supply enough power to replace this lost energy by converting fuel energy. This is why fuel consumption increases dramatically at higher speeds.
Why Air Resistance Matters:
Air resistance grows with the square of velocity, meaning that doubling your speed requires roughly four times the power to overcome air resistance alone. This is why highway driving at high speeds consumes significantly more fuel than moderate-speed driving.
Rolling friction
Rolling friction acts on the tyres as they move along the road surface. In an ideal scenario, a wheel would roll without any slipping against the ground. However, in reality:
- There may be slight slipping between the tyre and road surface
- Both the tyre and road surface undergo deformation (change shape temporarily)
These factors combine to create rolling friction, which must be overcome by the engine to keep the car moving at constant speed.
Internal friction
Friction occurs at all points along the drive train of a car (the system that transmits power from the engine to the wheels). This internal friction reduces the efficiency of the vehicle by decreasing the force that the tyres can apply to the ground. Less of the engine's power actually reaches the wheels to propel the car forward.
Energy Loss Through Friction:
All these frictional forces reduce a car's efficiency and require the engine to supply additional power to maintain motion. In real-world driving:
- Air resistance is the dominant force at high speeds
- Rolling friction is significant at all speeds
- Internal friction constantly reduces the power available to the wheels
Understanding these forces helps explain why vehicle efficiency ratings vary so much between city and highway driving conditions.
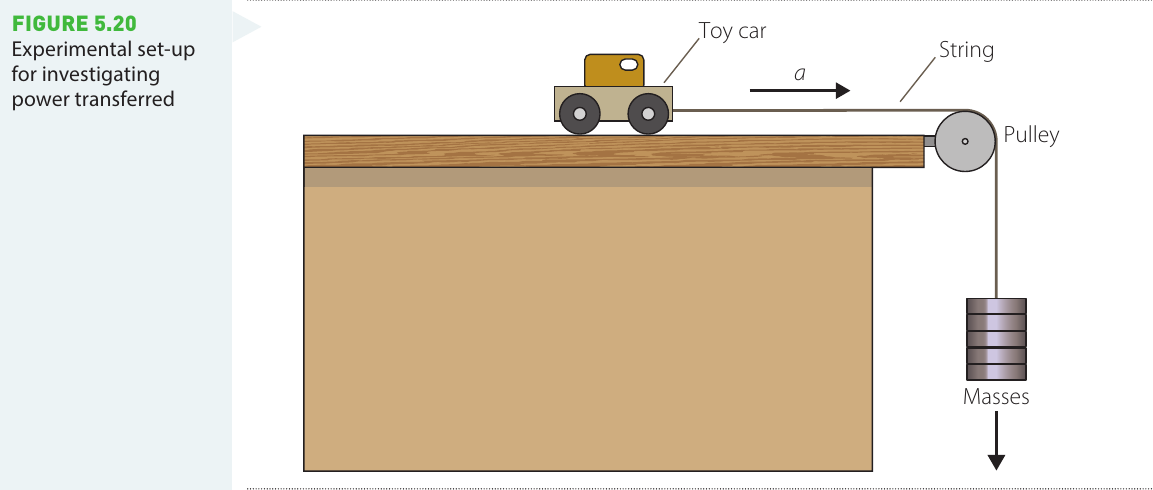
Investigation: power transfer
This practical investigation explores how energy transforms from gravitational potential energy to kinetic energy, and how to measure the rate of this energy transfer (power).
Aim
To investigate how power is transferred from falling weights to a toy car or block, and how friction affects this energy transfer.
Materials
- Pulley attached to table edge
- String
- Masses and mass holder
- Tape measure
- Tape
- Toy cars
- Blocks with different surfaces (smooth and rough)
- Stopwatch or motion sensor with data logger
Risk assessment
Safety Considerations:
| Hazard | Safety measure |
|---|---|
| Falling weights could land on someone | Keep area beneath weights clear |
Always ensure the area is clear before releasing the weights, and never reach under falling objects.
Method
Setup:
- Measure and record the masses of the toy car, blocks, and falling weights
- Set up your equipment as shown in the diagram, with the toy car lined up directly toward the pulley
- Mark start and finish lines on the table using tape
- Set up data-logging equipment to record the car's motion, or prepare a stopwatch
- Place the car at the start line and allow the weights to fall freely through a measured distance
- Record the motion or time how long it takes to reach the finish line
Variations to test:
- Lock the wheels so they cannot rotate (using tape) and repeat
- Repeat with blocks having various surface textures
Results
Record your measurements in a table:
| Object being pulled | Time for fall (s) | Final speed (m s⁻¹) | Change in (J) | Mass of falling weights (kg) | Distance fallen (m) | Change in (J) | Change in (J) |
|---|---|---|---|---|---|---|---|
| Car – rolling | |||||||
| Car – sliding | |||||||
| Rough block – sliding | |||||||
| Smooth block – sliding |
Analysis
Perform these calculations for each measurement:
- Calculate the final kinetic energy of the car/block:
- Calculate the power transferred to the car:
- Calculate the change in gravitational potential energy of the falling weights:
- Calculate the final kinetic energy of the weights: (Note: The weights and car move at the same speed because they're connected by the string)
- Calculate the power transformed into kinetic energy of the weights:
- Calculate the power transferred from the weights:
- Calculate the difference between the power from potential energy and the combined kinetic energy. This difference represents the rate at which energy is lost as thermal energy due to friction.
Key Analysis Point:
The difference between the power calculated from the loss of gravitational potential energy and the power calculated from the gain in kinetic energy tells you how much power is being dissipated through friction. This is a direct measure of energy loss in the system!
Discussion
Consider these questions:
- For each rolling and sliding situation, how much of the power from the falling weights increased the kinetic energy of the car/block?
- Was there a difference between sliding and rolling? What evidence is there for rolling resistance? How did kinetic friction affect sliding objects?
- Was mechanical energy conserved in any of these situations? Explain your reasoning.
Conclusion
Based on your data and analysis, write a conclusion that answers your inquiry question about power transfer and the effects of friction on energy transformation.
Key Points to Remember:
-
Power measures how quickly work is done or energy is transferred:
-
The unit of power is the watt (W): , representing one joule of energy transferred per second
-
Power can be calculated from force and velocity: (or simply when force and velocity are in the same direction)
-
Graphical relationships: On an energy-time graph, power is the gradient; on a power-time graph, energy is the area under the curve
-
Friction reduces efficiency: Air resistance, rolling friction, and internal friction all oppose motion and require additional power to overcome, reducing the overall efficiency of vehicles and machines