Spectra (HSC SSCE Physics): Revision Notes
Spectra
Spectra are patterns of light that help us understand the structure of atoms. Different elements produce unique spectral patterns that act like fingerprints, allowing scientists to identify elements. This note focuses on the hydrogen spectrum, which provided crucial evidence for understanding atomic structure.
Spectroscopy has become one of the most powerful analytical tools in science, enabling us to identify elements not only on Earth but also in distant stars and galaxies. The unique spectral patterns act as a universal identification system for elements throughout the universe.
What are spectra?
A spectrum (plural: spectra) is the pattern of light separated into its component wavelengths. There are three main types:
- Emission spectrum: bright coloured lines on a dark background, produced when excited atoms emit light at specific wavelengths
- Absorption spectrum: dark lines on a continuous coloured background, created when atoms absorb specific wavelengths from white light
- Continuous spectrum: an unbroken band of all colours, produced by hot solid objects or dense gases
Key Insight
Each element produces a characteristic pattern of spectral lines. This discovery revolutionised chemistry and physics, allowing scientists to identify elements and understand atomic structure without physically possessing a sample of the material.
Observing spectra using gas discharge tubes
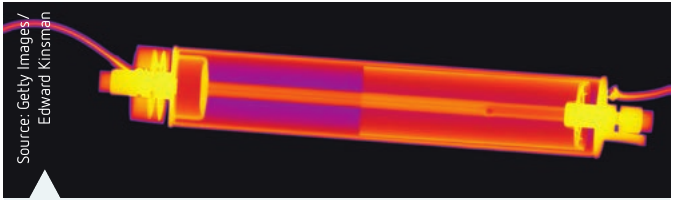
When electrical energy passes through a gas at low pressure inside a glass tube, the gas glows with a characteristic colour. This device is called a gas discharge tube.
Different elements produce distinctly different colours when energised in this way:
- Helium produces a pinkish-orange glow
- Neon glows bright orange-red (familiar from "neon lights")
- Argon appears blue-violet
- Krypton emits a whitish-blue light
- Xenon produces a blue-white glow
Historical Context: The Birth of Spectroscopy
Gustav Kirchhoff and Robert Bunsen recognised in the 1860s that these line spectra could be used to identify elements. In 1861, they discovered two new elements—caesium and rubidium—using spectroscopy. This demonstrated the power of spectroscopy as an analytical tool and opened up entirely new possibilities for chemical analysis.
Investigation 15.1: Observing spectra
This practical investigation allows you to observe and photograph the emission spectrum of hydrogen gas.
Aim
To observe and photograph the emission spectrum of hydrogen.
Materials
- Hand-held spectroscope
- Hydrogen gas discharge tube
- Induction coil or similar high-voltage apparatus
- 12V power pack
- Alligator leads
- Darkened room/laboratory
- Suitable camera (such as a mobile phone)
Safety considerations
Safety Warning
High voltage equipment poses an electric shock hazard. Always disconnect the power before handling any apparatus. Ensure the induction coil and discharge tube are not touched whilst the power is connected.
Method
- Connect the hydrogen discharge tube to the induction coil and 12V power pack. Ensure the power remains disconnected whilst handling the apparatus.
- Switch on the power and observe the spectrum produced by the hydrogen through the hand-held spectroscope.
- Carefully align the camera lens with the eyepiece of the spectroscope and photograph the spectrum you observe.
Results
When you look through the spectroscope at the hydrogen discharge tube, you will observe a pattern of discrete bright coloured lines against a dark background. These lines appear at specific wavelengths in the visible region of the spectrum.
Discussion points
Why is this an emission spectrum?
This is classified as an emission spectrum because the hydrogen atoms are emitting light at specific wavelengths, producing bright lines on a dark background. The atoms absorb electrical energy, become excited, and then release this energy as light photons of particular wavelengths.
What mechanism produces this spectrum?
Electrons in hydrogen atoms absorb energy from the electrical discharge. This causes them to jump to higher energy levels (excited states). When these electrons fall back to lower energy levels, they emit photons of light. The energy difference between the levels determines the wavelength (colour) of the emitted light. Since only certain energy levels exist in the atom, only specific wavelengths are emitted, producing the characteristic line pattern.
The hydrogen spectrum
Hydrogen is the simplest element, containing just one electron. This makes it ideal for studying atomic structure. When hydrogen gas is excited in a discharge tube, it produces spectral lines in three regions of the electromagnetic spectrum: ultraviolet, visible, and infrared.
Emission and absorption spectra
The hydrogen spectrum can be observed in two forms:
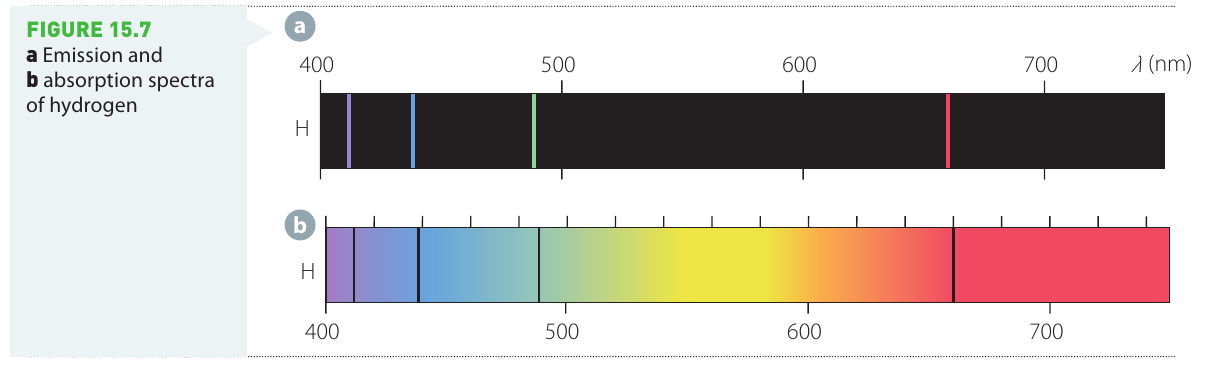
The emission spectrum (top) shows bright coloured lines at specific wavelengths on a dark background. These represent the wavelengths of light emitted by excited hydrogen atoms.
The absorption spectrum (bottom) displays a continuous rainbow of colours with dark lines at specific wavelengths. These dark lines appear at exactly the same positions as the bright lines in the emission spectrum. When white light passes through cool hydrogen gas, the atoms absorb light at these specific wavelengths, creating the dark absorption lines.
Key Observation: Spectral Line Correspondence
The dark lines in an absorption spectrum occur at precisely the same wavelengths as the bright lines in the emission spectrum for the same element. This relationship provided important evidence about the quantised nature of atomic energy levels.
Spectral series of hydrogen
Although scientists had observed spectral patterns, there was initially no theory explaining why they existed. It was presumed that these characteristic spectra related to the internal structure of atoms. Hydrogen, being the simplest atom, became the focus of intense investigation.
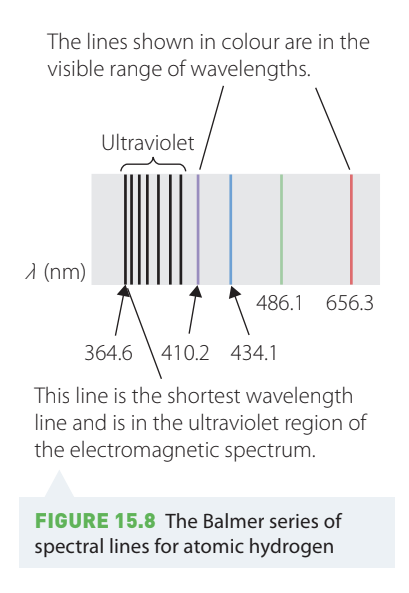
In 1855, Swiss mathematician Johann Balmer derived an empirical formula for the visible spectral lines of hydrogen. He discovered that the observed wavelengths were proportional to , where and is greater than . This series of visible lines is now called the Balmer series.
Further research revealed that hydrogen produces several series of spectral lines:
Spectral Series Details
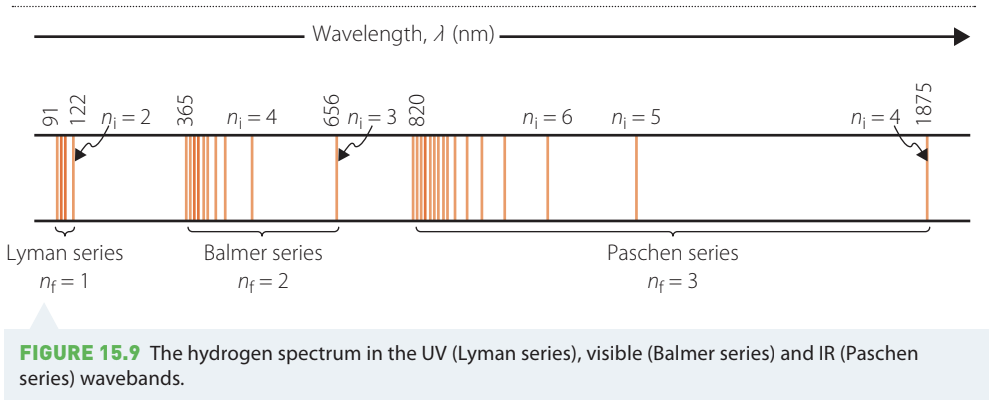
Lyman series ():
- Located in the ultraviolet region
- Shortest wavelength line: 91 nm
- Longest wavelength line in this series: 122 nm
- Produced when electrons fall to the first energy level ()
Balmer series ():
- Located in the visible region
- Wavelengths range from 365 nm to 656 nm
- The visible lines appear at: 410.2 nm (violet), 434.1 nm (blue), 486.1 nm (blue-green), and 656.3 nm (red)
- Produced when electrons fall to the second energy level ()
Paschen series ():
- Located in the infrared region
- Wavelengths range from 820 nm to 1875 nm
- Produced when electrons fall to the third energy level ()
Additional series exist at even longer wavelengths: the Brackett series and Pfund series. All these series follow similar patterns but with different values for the initial () and final () energy levels.
Electron transitions and spectral lines
The spectral lines correspond to electron transitions between different energy shells in the hydrogen atom:
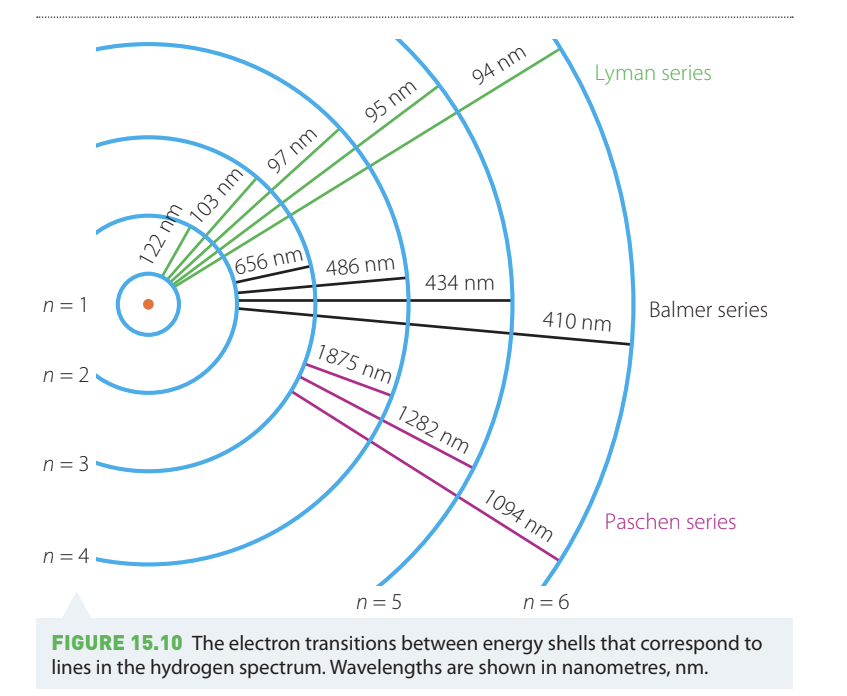
Each coloured arrow in the diagram represents an electron transition that produces a spectral line. The wavelength of the emitted light depends on the energy difference between the two levels:
- Lyman series (green arrows): electrons falling from higher levels () to the ground state (). These transitions involve the largest energy changes, producing ultraviolet photons with wavelengths from 94 nm to 122 nm.
- Balmer series (black arrows): electrons falling from higher levels () to . These intermediate energy changes produce visible light with wavelengths from 410 nm to 656 nm.
- Paschen series (magenta arrows): electrons falling from higher levels () to . These smaller energy changes produce infrared radiation with wavelengths from 1094 nm to 1875 nm.
Exam Tip
Remember that larger electron jumps (like from to ) release more energy and produce shorter wavelength (higher frequency) photons. Smaller jumps produce longer wavelength photons.
The spacing between spectral lines within each series follows a pattern: the lines get closer together as the wavelength decreases, converging toward a series limit. This pattern provided crucial evidence for the quantised nature of atomic energy levels.
Key Points to Remember:
- Each element produces a unique pattern of spectral lines that acts as a fingerprint for identification
- Emission spectra show bright coloured lines on a dark background; absorption spectra show dark lines on a continuous coloured background
- The hydrogen spectrum consists of several series: Lyman (UV), Balmer (visible), and Paschen (IR)
- Spectral lines are produced when electrons transition between specific energy levels in atoms
- The wavelength of emitted light depends on the energy difference between the initial and final electron energy levels
- Larger energy transitions produce shorter wavelengths; smaller transitions produce longer wavelengths