Graphical Representations of Waves (HSC SSCE Physics): Revision Notes
Graphical Representations of Waves
When studying waves, it's essential to understand how to represent them visually and interpret the information they contain. Graphs allow us to analyse wave properties and compare different waves easily. In this note, you'll learn about the key terminology used to describe waves and how to use two important types of graphs to represent wave motion.
Visual representation is crucial for understanding wave behaviour. The two main types of graphs—displacement versus time and displacement versus distance—each reveal different but complementary information about wave properties.
Understanding wave terminology
Waves have several characteristics that we can measure and describe. To work effectively with waves, you need to understand what these terms mean and how they relate to the physical behaviour of the wave.
Period () represents the time it takes for a wave to complete one full cycle and repeat itself. Think of it as the time between one crest passing a point and the next crest arriving at that same point. Period is measured in seconds (s).
The period describes temporal behaviour—it tells you about the wave's motion over time at a fixed point in space.
Amplitude () describes the maximum distance a particle in the medium moves from its rest position as the wave passes through. For transverse waves, this is the height from the centre line to the top of a crest (or the depth to the bottom of a trough). Amplitude is measured in metres (m).
Frequency () tells us how many wave crests (or compressions in longitudinal waves) are generated in one second. A wave with a frequency of Hz produces 400 crests every second. The unit for frequency is hertz (Hz), which is equivalent to per second ().
Wavelength () measures the distance between two successive corresponding points on a wave. You can measure this between two adjacent crests, two adjacent troughs, or any two equivalent points on consecutive waves. Wavelength is measured in metres (m).
For transverse waves, the highest point of the wave is called the crest, whilst the lowest point is called the trough.
Key wave characteristics
The table below summarises the important characteristics of waves that you need to know:
| Term | Definition | Symbol | Unit |
|---|---|---|---|
| Displacement | Distance away from the rest position of a particle | metre (m) | |
| Amplitude | Largest distance away from the rest position that a particle moves before returning | metre (m) | |
| Frequency | Number of crests (or compressions) generated in 1 second | hertz (Hz) or () | |
| Wavelength | Distance between successive crests | metre (m) | |
| Period | Time it takes before a wave repeats itself | second (s) | |
| Speed | Distance travelled per second | metres per second () |
Displacement () specifically refers to how far a particle is from its rest position at any given moment. This value can be positive (above the rest position) or negative (below the rest position).
Displacement versus time graphs
A displacement versus time graph shows how a single particle in the medium moves up and down (or back and forth) as a wave passes through it. This type of graph is particularly useful for determining the period of a wave.
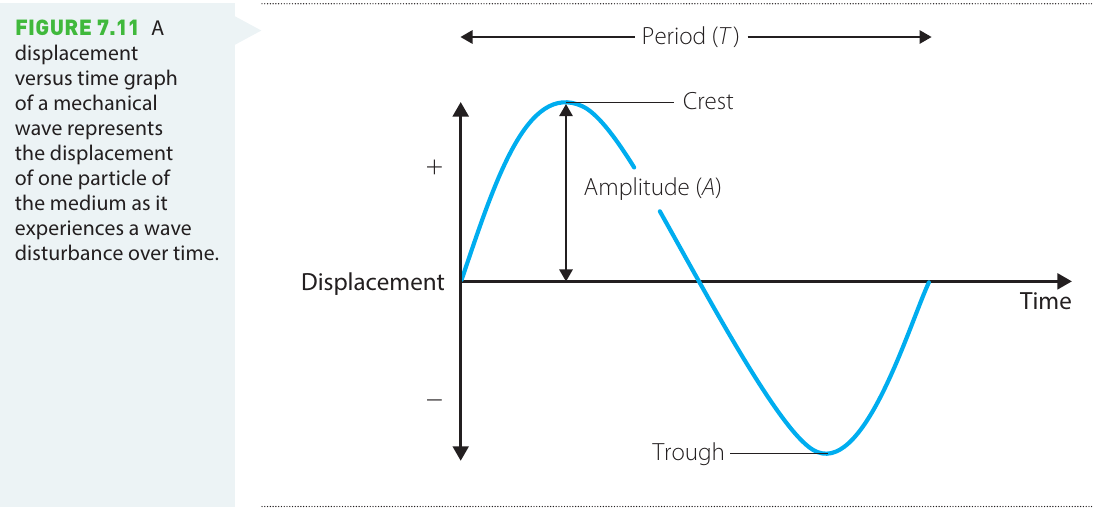
In this graph:
- The horizontal axis represents time
- The vertical axis represents displacement from the rest position
- The period () is shown as the horizontal distance between equivalent points on the wave (such as from one crest to the next crest)
- The amplitude () is the maximum displacement, measured from the rest position to a crest or trough
- The crest appears at the highest point of displacement
- The trough appears at the lowest point of displacement
This graph tracks the motion of one particle over time as the wave disturbance passes through it. The particle oscillates up and down (for a transverse wave) or back and forth (for a longitudinal wave) about its rest position. It does NOT show the shape of the wave in space.
Displacement versus distance graphs
A displacement versus distance graph shows a "snapshot" of the wave at one instant in time. It displays the displacement of all particles along the wave at that particular moment. This type of graph is ideal for determining the wavelength of a wave.
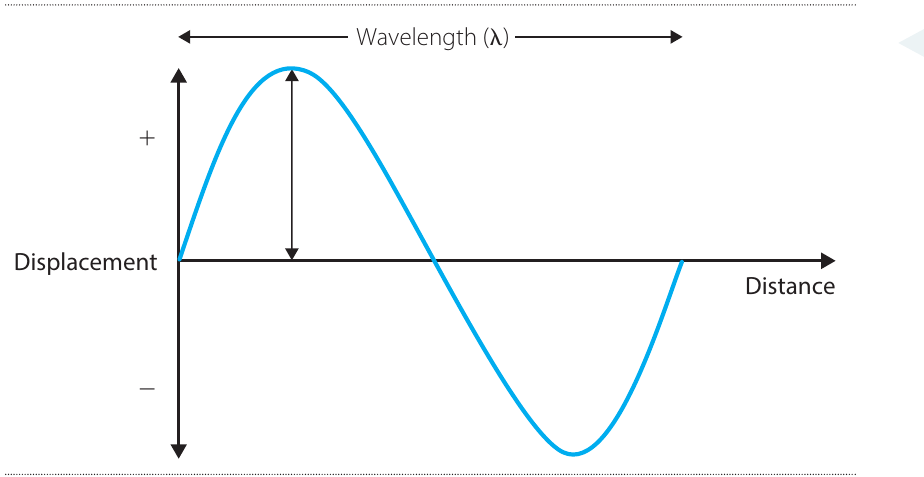
In this graph:
- The horizontal axis represents distance along the wave
- The vertical axis represents displacement from the rest position
- The wavelength () is shown as the horizontal distance between equivalent points on adjacent waves (such as from one crest to the next crest)
- The amplitude () is still the maximum displacement from the rest position
Both displacement versus time and displacement versus distance graphs can represent transverse or longitudinal waves. Remember that these graphs are not simply pictures of what the wave looks like. Instead, they plot the displacement of particles in the medium either at different times (for displacement versus time) or at different positions along the wave (for displacement versus distance).
Sketching wave graphs
When asked to sketch a wave graph, you need to carefully label your axes and choose an appropriate scale. Let's look at an example:
Worked Example: Sketching a Displacement versus Distance Graph
Question: Sketch a displacement versus distance graph for a wave with a wavelength of m and an amplitude of cm.
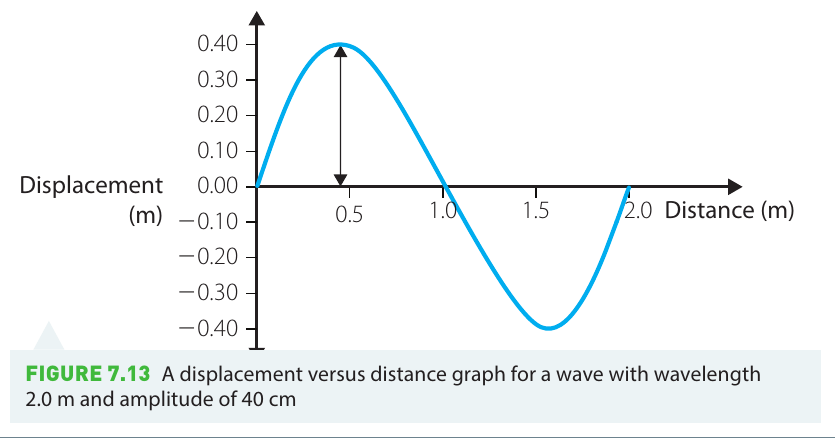
Steps to follow:
- Draw and label both axes clearly
- Choose an appropriate scale for each axis based on the values given in the question
- Convert all measurements to the same units (in this case, convert 40 cm to 0.40 m)
- Draw a smooth sinusoidal curve that accurately represents the wavelength and amplitude
- Ensure one complete wavelength spans m horizontally
- Ensure the amplitude extends m above and below the rest position
Wavenumber
Wavenumber () provides another way to describe waves. It represents the number of complete waves that fit within one metre of length. Although wavenumber is not part of the core syllabus, understanding it can deepen your knowledge of wave behaviour.
The wavenumber is calculated using the formula:
where is the wavelength and is a mathematical constant.
Worked Example: Calculating Wavenumber
Question: Find the wavenumber for a wave with a wavelength of mm.
Solution:
Step 1: Convert the wavelength to SI units:
Step 2: Substitute into the formula:
Answer: The wavenumber is per metre.
Exam tips
Essential Tips for Wave Graph Questions:
When working with wave graphs:
- Always label both axes clearly with the quantity and unit
- Choose sensible scales that make the wave easy to read
- Draw smooth curves, not jagged lines
- Check that your wavelength or period matches the value given in the question
- Remember that amplitude is always measured from the rest position, not from trough to crest
- For displacement versus time graphs, one complete oscillation represents the period
- For displacement versus distance graphs, one complete oscillation represents the wavelength
Summary
Key Points to Remember:
- Wave graphs use displacement (distance from rest position) on the vertical axis
- A displacement versus time graph shows how one particle moves as the wave passes and reveals the period ()
- A displacement versus distance graph shows all particles' positions at one instant and reveals the wavelength ()
- Both types of graphs clearly show the amplitude (), which is the maximum displacement from the rest position
- When sketching wave graphs, always include clearly labelled axes with appropriate scales
- The wavenumber () indicates how many waves fit in one metre