Relative Mass (VCE SSCE Chemistry): Revision Notes
Relative Mass
Introduction to relative mass in chemistry
Chemists working in diverse fields such as environmental monitoring, pharmaceuticals, and fuel production regularly perform chemical reactions. Being able to measure specific amounts of reactants quickly and accurately is crucial because the quantity of products formed depends on the amount of reactants used.
Individual atoms and molecules are far too small to be counted, even in groups of thousands or millions. Instead, chemists rely on knowledge of atomic and molecular masses to measure out the quantities they need for reactions.
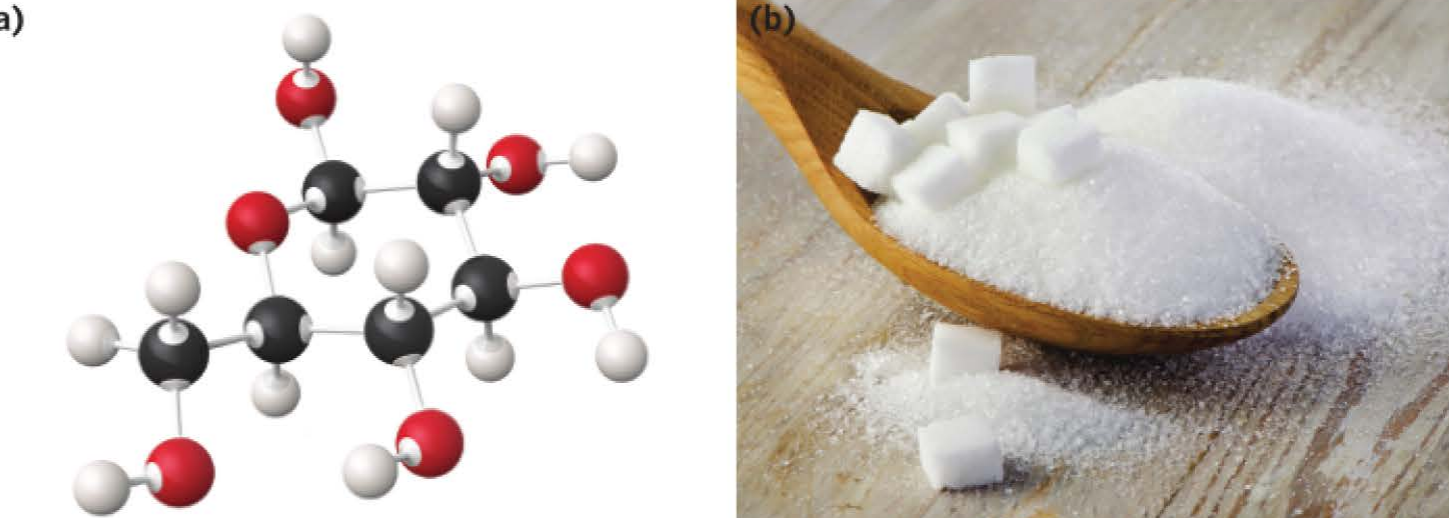
The mass of a single atom is incredibly tiny. For example, one carbon atom has a mass of approximately g. A single glucose molecule, which contains 6 carbon atoms, 12 hydrogen atoms, and 6 oxygen atoms bonded together, has an actual mass of g. A teaspoon of glucose contains approximately glucose molecules.
These masses are so extraordinarily small that they are impractical to measure directly and inconvenient to use in calculations. Even the most sensitive laboratory balances cannot detect such minuscule masses, which is why chemists needed to develop an alternative approach.
To overcome this problem, chemists use more convenient measures called relative masses to determine quantities in samples.
Understanding relative masses
In chemistry, we typically work with relative masses rather than actual masses. A relative mass is determined by comparison to a standard mass, making calculations more manageable.
The carbon-12 standard
The standard against which all relative masses in chemistry are compared is the common isotope of carbon, carbon-12 (represented as C). This isotope is assigned an exact mass value of 12 units. All other atomic and molecular masses are expressed relative to this standard.
Carbon-12 was chosen as the universal standard in 1961 after physicists and chemists agreed on this compromise. Previously, oxygen was used as the standard, but there were two different systems in use, leading to confusion. The adoption of carbon-12 created a unified scale that is used worldwide today.
Relative isotopic mass
Each individual isotope of an element has its own relative isotopic mass. This is defined as the mass of an atom of that isotope compared to the mass of a carbon-12 atom, which is taken as exactly 12 units.
Comparing isotopes to carbon-12
The table below shows how the masses of various isotopes compare to carbon-12:
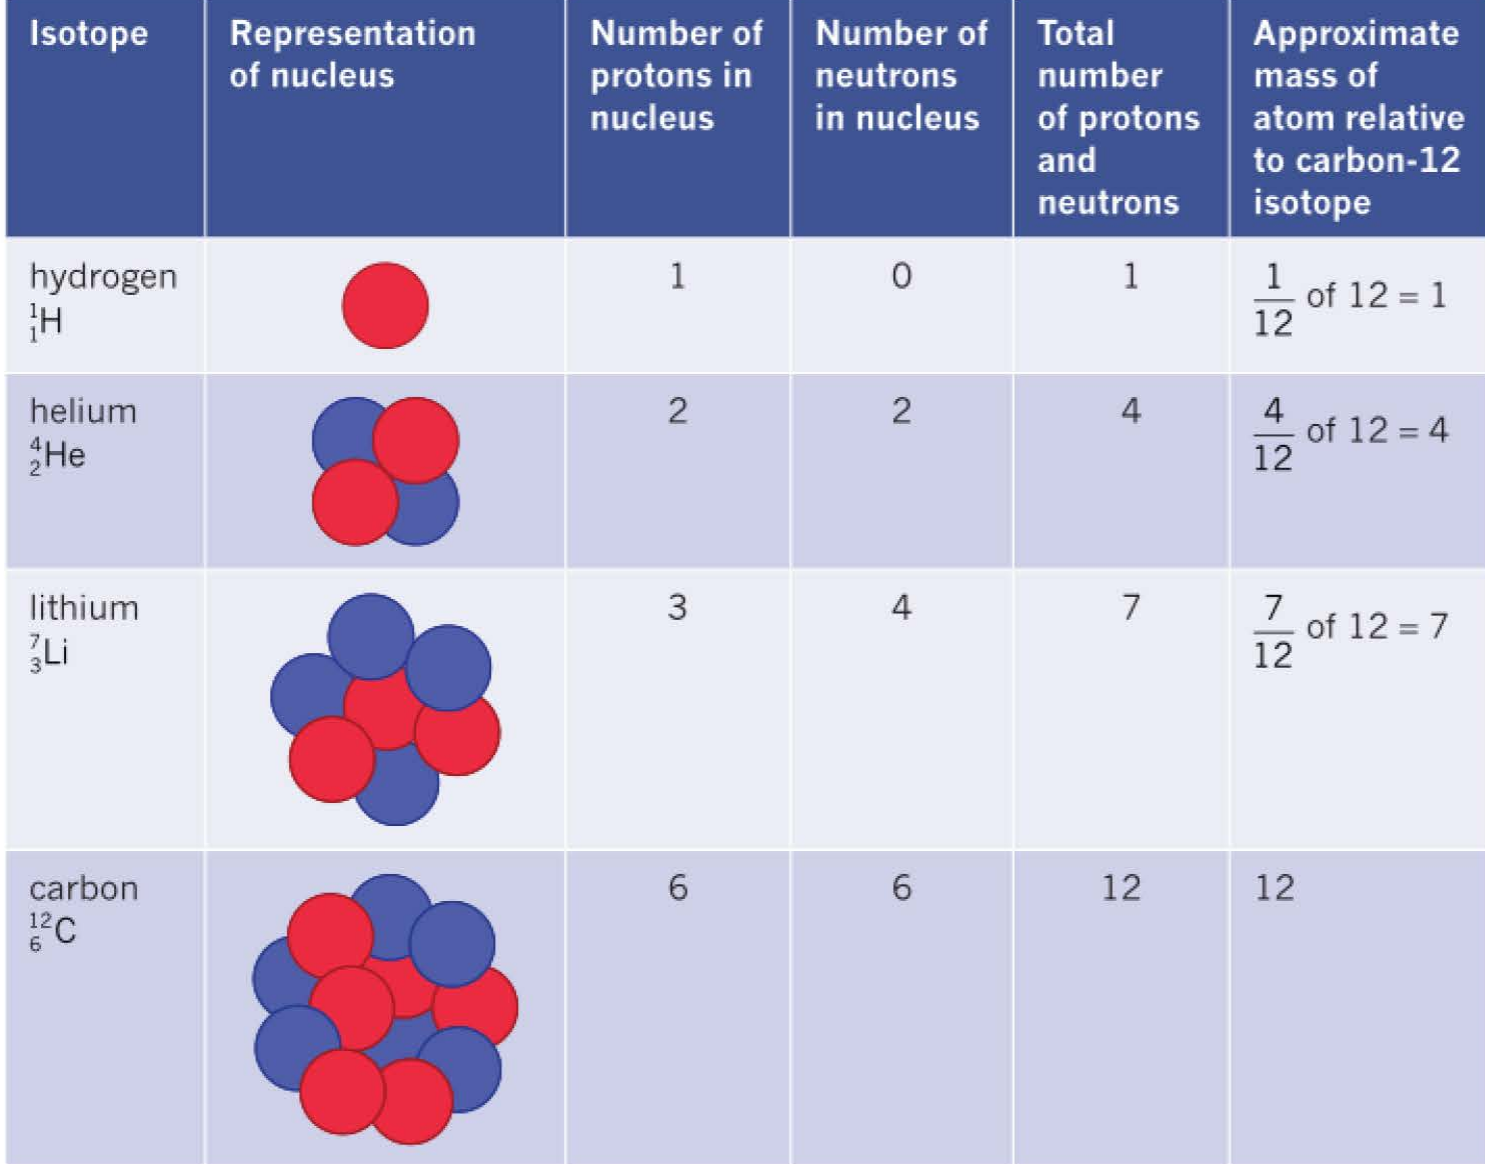
Since the masses of protons and neutrons are similar and close to 1 on the C = 12 scale, the relative isotopic mass of an isotope is almost (but not exactly) equal to the total number of protons and neutrons in its nucleus. The small difference arises from the binding energy that holds the nucleus together.
Isotopes and their different masses
Recall that isotopes are atoms of the same element that contain different numbers of neutrons in their nucleus. They have the same atomic number but different mass numbers.
Chlorine provides a good example of isotopes. The element chlorine exists as two isotopes:
- Cl, which contains 17 protons and 18 neutrons
- Cl, which contains 17 protons and 20 neutrons
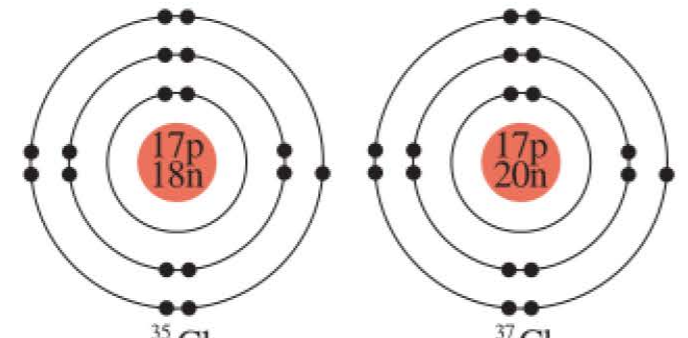
The isotopes have different masses because they contain different numbers of neutrons. Remember that an atom's mass is mainly determined by the number of protons and neutrons in the nucleus, since electrons have relatively insignificant mass.
The relative isotopic masses of the two chlorine isotopes have been experimentally determined to be 34.969 (Cl) and 36.966 (Cl). Notice how these values are close to, but not exactly equal to, the mass numbers (35 and 37).
Relative isotopic abundance
Naturally occurring chlorine consists of a mixture of the two isotopes shown above. Of all chlorine atoms that exist in nature, 75.80% are the lighter isotope (Cl) and 24.20% are the heavier isotope (Cl). This composition remains virtually the same regardless of the source of the chlorine sample.
The percentage of an isotope found in the natural environment is called its relative isotopic abundance. Most elements, like chlorine, exist as a mixture of two or more isotopes in nature.
Examples of isotopic composition
The table below shows the isotopic composition of some common elements:
| Element | Isotopes | Relative isotopic mass | Relative isotopic abundance (%) |
|---|---|---|---|
| hydrogen | H | 1.008 | 99.986 |
| H | 2.014 | 0.014 | |
| H | 3.016 | 0.0001 | |
| oxygen | O | 15.995 | 99.76 |
| O | 16.999 | 0.04 | |
| O | 17.999 | 0.20 | |
| silver | Ag | 106.9 | 51.8 |
| Ag | 108.9 | 48.2 |
Notice that some isotopes are much more abundant than others. For example, hydrogen-1 makes up 99.986% of all naturally occurring hydrogen atoms, while silver's two isotopes are present in nearly equal amounts.
Mass spectrometry
The relative isotopic masses of elements and their isotopic abundances are determined using an instrument called a mass spectrometer, which was invented by Francis Aston in 1919.
How a mass spectrometer works
A mass spectrometer is a laboratory instrument used to:
- Detect different isotopes of an element
- Determine the relative mass of each isotope
- Measure the abundance of each isotope
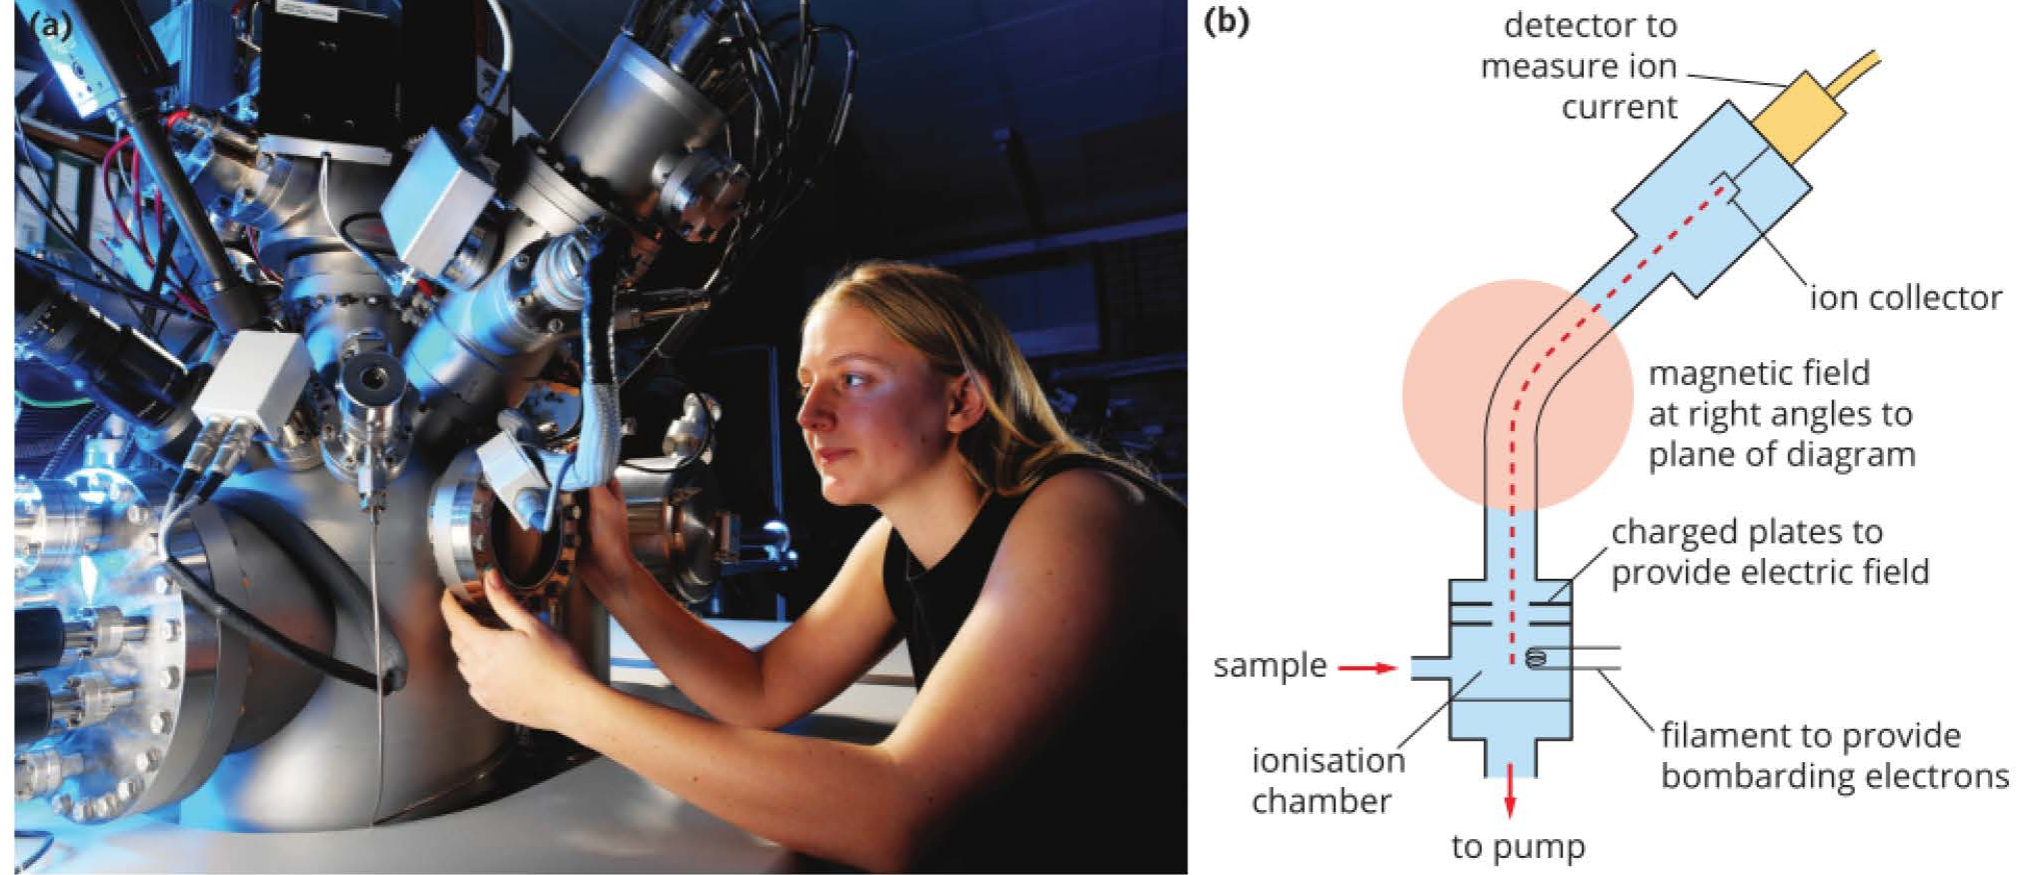
Inside a mass spectrometer:
- A sample of an element is introduced into an ionisation chamber
- The sample is ionised (atoms are converted to ions by electron bombardment)
- The ions are accelerated through charged plates that create an electric field
- The ions pass through a magnetic field, which deflects them according to their mass-to-charge ratio
- Ions with different masses are deflected by different amounts
- A detector measures the ion current for each mass-to-charge ratio
- The results are displayed as a mass spectrum
Applications of mass spectrometry
Mass spectrometry has many practical applications beyond simply identifying isotopes. Scientists can use this technique to determine the relative abundance of isotopes in tissues from living or once-living organisms, providing insights into the organism's life history.
Marine biology application: Mass spectrometry can reveal the migratory history of marine animals, such as whales. Scientists analyse oxygen isotopes present in barnacle shells attached to whales. As barnacles grow, the types and abundances of oxygen isotopes in their shells reflect both the salinity (salt concentration) and temperature of the surrounding water. As the whale moves through different ocean regions with varying temperatures and salinities, this information becomes recorded in the barnacle shells, creating a chemical "diary" of the whale's journey.

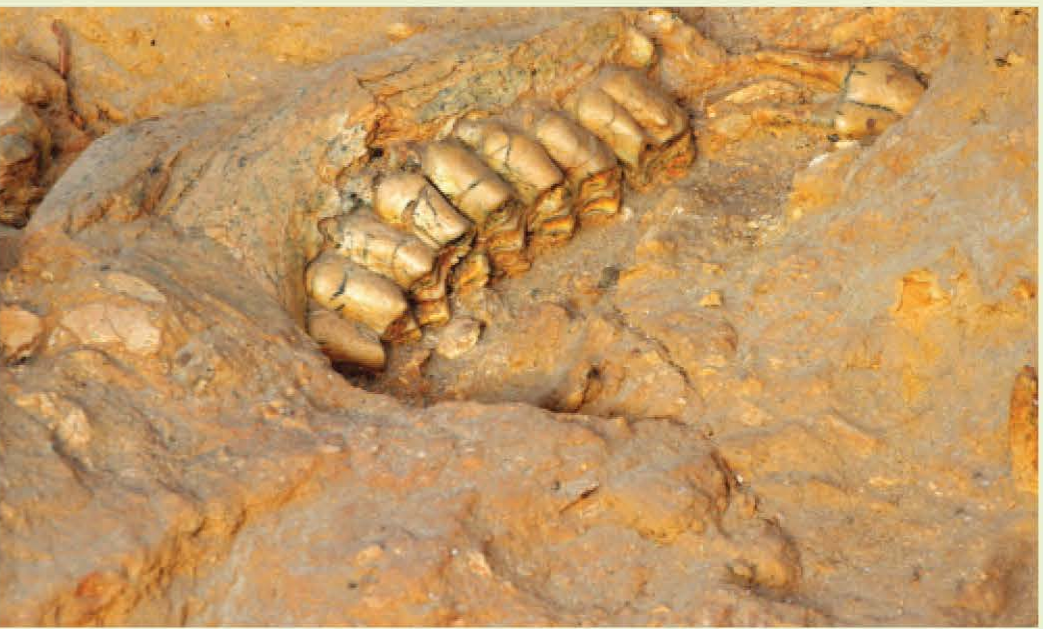
Archaeological application: Archaeologists can analyse fossil remains, such as the jawbone of an extinct short-necked giraffe, to study the animal's diet and determine its habitat. The oxygen isotopic composition of carbonate and phosphate in bones and teeth is primarily determined by the surface water the animal drank or the water in its food. The abundances of different isotopes in teeth and bones represent the chemical signature of the region where the animal was born and raised.
Interpreting a mass spectrum
A mass spectrum is a graph that displays the results from a mass spectrometer. Understanding how to read this graph is essential for determining isotopic composition.
Mass spectrum of chlorine
The mass spectrum of chlorine shows two distinct peaks:
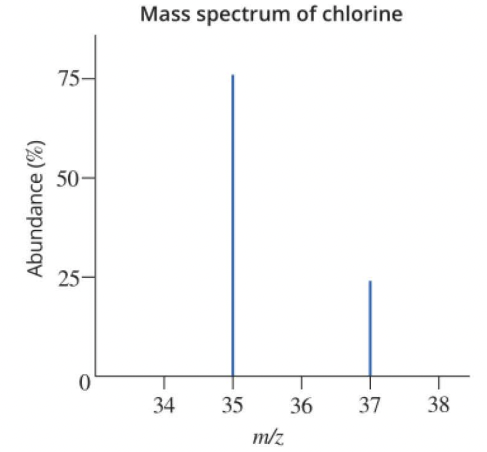
Key features of a mass spectrum:
- Number of peaks indicates the number of isotopes present. Chlorine has two peaks, showing it has two isotopes.
- Horizontal axis shows the mass-to-charge ratio (m/z or m/e). Since most ions reaching the detector have a charge of 1+, the mass of an isotope can be read directly from this axis. The two chlorine isotopes have relative masses of approximately 35 and 37.
- Vertical axis indicates the relative abundance of each isotope. For chlorine, approximately 75% of atoms are Cl and approximately 25% are Cl.
Relative atomic mass
Most elements consist of a mixture of isotopes, each with a different relative mass. For calculations, it is convenient to know the average relative mass of an atom in the mixture of isotopes.
Definition and formula
The average relative mass of an element is called the relative atomic mass, given the symbol . The relative atomic mass of an element is the weighted average of the relative masses of the isotopes of the element on the C scale.
The formula for calculating relative atomic mass is:
For elements with more than two isotopes, additional terms are added to the numerator following the same pattern.
Why use a weighted average?
A weighted average is necessary because isotopes do not occur in equal amounts. The more abundant an isotope is, the greater its contribution to the overall average mass. This is similar to calculating a course grade where assignments are weighted differently - a major exam worth 50% of your grade has a much bigger impact than a quiz worth 5%.
Calculating relative atomic mass
To calculate the relative atomic mass from isotopic data, you need to consider both the mass and abundance of each isotope.
Worked Example: Determining the relative atomic mass of chlorine
Let's determine the relative atomic mass of chlorine using data from its mass spectrum:
| Isotope | Relative isotopic mass | Relative abundance (%) |
|---|---|---|
| Cl | 34.969 | 75.80 |
| Cl | 36.966 | 24.20 |
Step 1: Identify the isotopes from the mass spectrum
- Two peaks indicate two isotopes
- First isotope: relative isotopic mass 34.969; abundance 75.80%
- Second isotope: relative isotopic mass 36.966; abundance 24.20%
Step 2: Substitute values into the formula
Step 3: Calculate
Step 4: Express to the correct number of significant figures
Most periodic tables include the relative atomic mass of each element, calculated by taking into account the relative abundances of all natural isotopes.
Practice calculation: boron
Boron has two isotopes with the following data:
| Isotope | Relative isotopic mass | Relative abundance (%) |
|---|---|---|
| B | 10.013 | 19.91 |
| B | 11.009 | 80.09 |
You would follow the same steps as shown in the chlorine example to calculate the relative atomic mass of boron. Try working through this calculation yourself to practice the method.
Calculating percentage abundances
Sometimes you know the relative atomic mass and the relative isotopic masses, but need to find the percentage abundances of the isotopes. This requires solving an algebraic equation.
Worked Example: Calculating percentage abundances for rubidium
The relative atomic mass of rubidium is 85.47. The relative isotopic masses of its two isotopes are 84.95 and 86.94. Calculate the relative abundances of these isotopes.
Step 1: Define variables
- Let x = abundance of the lighter isotope (84.95)
- Then abundance of heavier isotope = 100 - x
Step 2: Substitute into the formula
Step 3: Expand the equation
Step 4: Multiply both sides by 100
Step 5: Rearrange and solve
Step 6: Calculate the other abundance
Abundance of 86.94 isotope = 100 - 73.87 = 26.13%
Therefore: The lighter isotope (84.95) has an abundance of 73.87% and the heavier isotope (86.94) has an abundance of 26.13%.
Using significant figures in calculations
When performing calculations involving relative masses, remember that the accuracy of your answer is limited by the least accurate piece of information used.
Key rule: Your answer must have the same number of significant figures as the least accurate value used in the calculation.
For example, if relative isotopic masses are given to five significant figures but relative abundances are given to only four significant figures, your calculated answer should be expressed to four significant figures.
This ensures that your answer does not falsely suggest greater precision than the original data supports.
Key Points to Remember:
- Relative mass is based on comparison to carbon-12, which is assigned an exact value of 12 units
- Relative isotopic mass is the mass of a specific isotope compared to carbon-12
- Relative isotopic abundance is the percentage of each isotope found in nature
- Mass spectrometers determine both the mass and abundance of isotopes
- Relative atomic mass () is the weighted average of isotopic masses, taking abundances into account
- The formula for calculating involves multiplying each isotopic mass by its percentage abundance, adding these products together, and dividing by 100
- Always express answers to the appropriate number of significant figures based on the given data