Correlation and Causality (VCE SSCE General Mathematics): Revision Notes
Correlation and Causality
Introduction
When we observe a strong correlation between two variables, it can be tempting to conclude that one causes the other. However, this assumption can lead to incorrect conclusions. Understanding the difference between association (correlation) and causation is essential in data analysis.
Association refers to a relationship between two variables. When two variables are associated, changes in one variable tend to occur alongside changes in the other variable.
Causation (or causality) means that changes in one variable directly cause changes in another variable.
A surprising example
Studies have revealed a strong positive correlation between the number of IKEA stores per 10 million population in a country and the number of Nobel laureates per 10 million population in that country. The correlation coefficient is , indicating a very strong positive association.
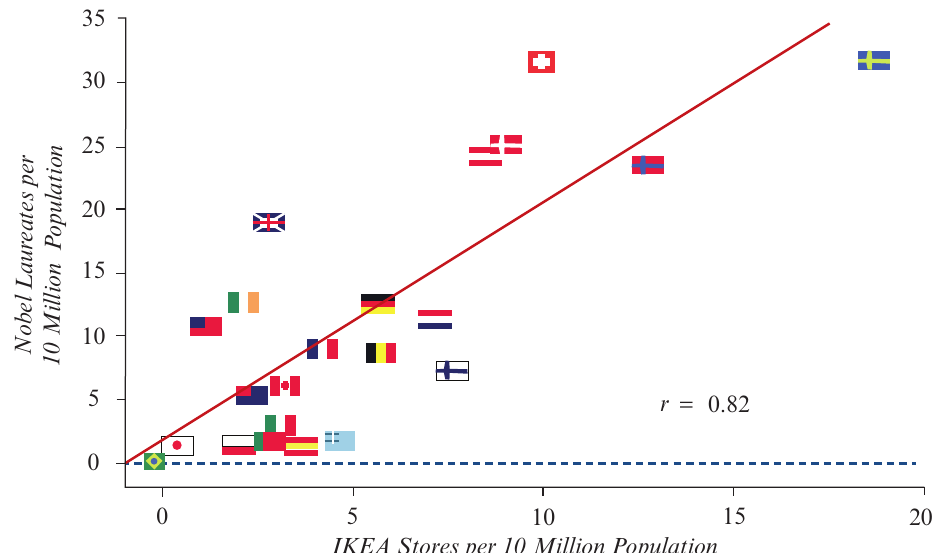
Based on this strong correlation, should we conclude that building more IKEA stores would increase the number of Nobel prize winners in Australia?
Almost certainly not! This example perfectly illustrates why we must be cautious about interpreting correlations as causal relationships. Despite the strong correlation (), there is no plausible mechanism by which building furniture stores would cause more Nobel prizes to be awarded.
The fundamental principle: Correlation does not imply causality
A correlation coefficient measures the strength and direction of the linear association between two variables. However, correlation tells us nothing about whether one variable causes changes in the other.
Key principle: A correlation tells you about the strength of the association between variables, but it reveals nothing about the source or cause of that association.
Even when we observe a very strong correlation, we cannot automatically conclude that the relationship is causal. The correlation might exist for entirely different reasons, which we'll explore in the following sections.
Establishing causality
To establish that one variable causes changes in another, we need to conduct a properly designed experiment.
What makes a proper experiment?
In a well-designed experiment:
- The explanatory variable (the variable we think might cause changes) is deliberately manipulated by the researcher
- All other possible explanatory variables are kept constant or controlled
- Participants are randomly allocated to different groups
Random allocation is the process of assigning participants to groups using a random method (like drawing names from a hat). This ensures that the groups are as similar as possible before the experiment begins.
Example: The classroom experiment
Here's a simplified example of how an experiment might work:
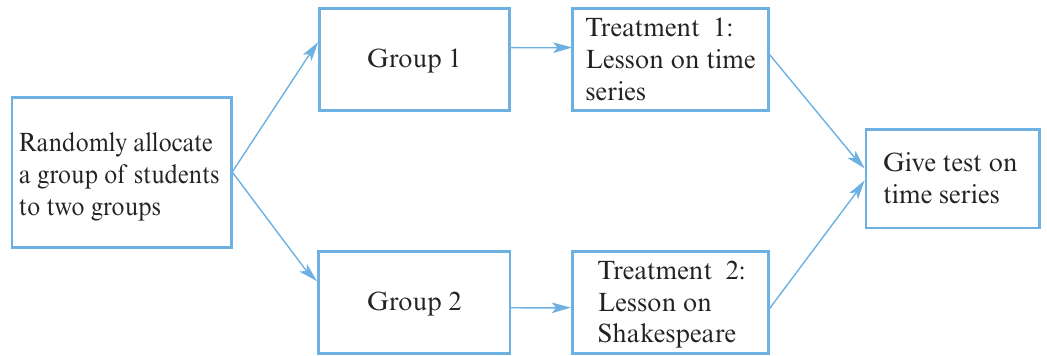
Worked Example: Establishing Causation Through Controlled Experiment
The study design:
- A class of students is randomly divided into two groups
- Group 1 receives Treatment 1: a lesson on time series
- Group 2 receives Treatment 2: a lesson on Shakespeare
- Both lessons are given under identical classroom conditions
- The next day, both groups take a test on time series
- Group 1 performs better than Group 2 on the test
Identifying the variables:
- Response variable: The students' test scores
- Explanatory variable: The type of lesson received (time series or Shakespeare)
Can we conclude the lesson caused the difference?
Yes, this conclusion is justified because:
- Students were randomly allocated to groups (making the groups initially similar)
- The only deliberate difference between groups was the lesson type
- All other factors (classroom conditions, timing, etc.) were controlled
- Therefore, the difference in test scores can reasonably be attributed to the lesson type
The challenge with real-world studies
Unfortunately, conducting properly controlled experiments is extremely difficult, especially when studying people going about their everyday lives. Many factors cannot be controlled or manipulated for ethical or practical reasons.
When data are collected through observation rather than experimentation, a strong association between two variables does not provide sufficient evidence to conclude causation. There will always be alternative, non-causal explanations for the observed association.
Possible non-causal explanations for an association
When we observe a correlation between two variables but haven't conducted a controlled experiment, the association might be explained by one of several non-causal mechanisms.
Common response
A common response occurs when two variables are associated not because one causes the other, but because both are caused by a third variable.
Example: Sunscreen and Fainting
Suppose we observe a strong positive association between the number of people using sunscreen and the number of people fainting. Does this mean applying sunscreen causes people to faint?
Almost certainly not! The explanation lies in a third variable: temperature.
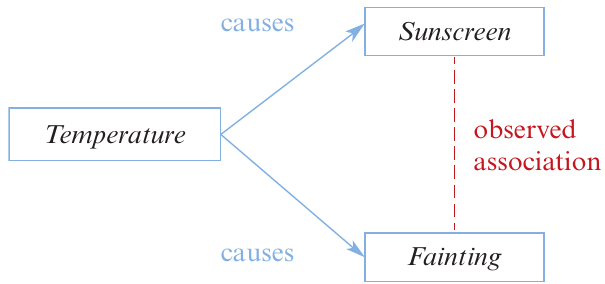
- On hot, sunny days, more people apply sunscreen
- On hot, sunny days, more people faint due to heat exhaustion
- Temperature causes both increased sunscreen use and increased fainting
- The two variables appear associated, but neither causes the other
This is the common response phenomenon: both variables respond to changes in a common third variable (temperature).
Confounding variables
Confounding occurs when we have at least two possible causal explanations for an observed association, but we cannot separate or distinguish their effects.
Example: Unemployment and Crime
Statistics show that crime rates and unemployment rates in cities are strongly correlated. Can we conclude that reducing unemployment will reduce crime?
Perhaps, but the situation is more complex than it appears.
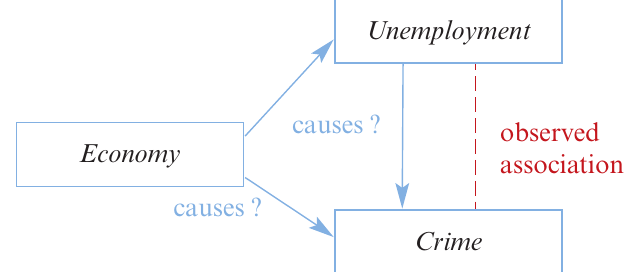
The observed correlation might be explained by:
- Unemployment directly causing crime (people commit crimes when jobless)
- The state of the economy causing both unemployment and crime
- Both factors working together in some combination
We cannot disentangle which explanation is correct. The effects of unemployment and economic conditions are confounded - we have no reliable way of knowing which is the actual cause of the association (or whether both contribute).
Confounding variables are particularly problematic: we can identify possible explanations, but we cannot determine which one (or which combination) is responsible for the observed association.
Coincidence
Sometimes an association occurs purely by chance, with no meaningful explanation at all.
Example: Margarine and Divorce
There is a remarkably strong correlation () between margarine consumption and the divorce rate in the American state of Maine. Can we conclude that eating margarine causes divorce?
Of course not! This association is best explained as purely coincidental.
When we cannot identify any feasible confounding variables or common causes to explain an association, we often conclude that the correlation is spurious - it has occurred purely by chance. We call this coincidence.
Even very strong correlations can be meaningless coincidences. This is why correlation coefficients alone never prove causation.
The role of lurking variables
Unless an association is completely spurious and meaningless, it will almost always be possible to identify at least one lurking variable - a variable not included in the study that could explain the observed association.
These lurking variables might be:
- Common causes (as in the temperature example)
- Confounding factors (as in the economy example)
- Part of a more complex causal chain
This is why observational studies, no matter how large or well-designed, can suggest but never definitively prove causal relationships.
Conclusion
The key message is clear and vitally important for anyone working with data:
An observed association between two variables is never sufficient evidence, by itself, to conclude that the variables are causally related - no matter how strong the correlation or how obvious the causal explanation appears to be.
This principle applies even when:
- The correlation coefficient is very close to or
- The relationship makes intuitive sense
- We can construct a plausible causal story
- The pattern appears consistent across multiple studies
To establish causation, we need:
- Properly designed experiments with random allocation
- Careful control of all other variables
- Deliberate manipulation of the explanatory variable
- Or, in observational studies, very sophisticated statistical techniques and a thorough understanding of all possible confounding factors
When reviewing statistical claims, always ask: "Is this correlation or causation?" The difference matters enormously for drawing valid conclusions and making sound decisions.
Remember!
Key Points to Remember:
-
Correlation measures association strength, not causation. A high correlation coefficient tells us variables are related, but not why or how.
-
Only properly designed experiments can establish causation. This requires random allocation, controlled conditions, and deliberate manipulation of the explanatory variable.
-
Three main non-causal explanations exist:
- Common response (third variable causes both)
- Confounding (multiple possible causes cannot be separated)
- Coincidence (chance association)
-
Beware of lurking variables. In observational studies, there are almost always alternative explanations for observed associations.
-
Never conclude causation from correlation alone. No matter how strong the association or how sensible it seems, correlation by itself never proves causation.