How to Interpret a Scatterplot (VCE SSCE General Mathematics): Revision Notes
How to Interpret a Scatterplot
Introduction to scatterplot interpretation
When analysing a scatterplot, our goal is to identify and describe any association (relationship) between two variables. To do this effectively, we examine specific features of the pattern formed by the data points.
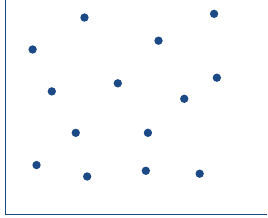
The first step is to determine whether there is a clear pattern in the scatterplot. When points are randomly scattered across the plot with no discernible pattern, we conclude that there is no association between the variables.
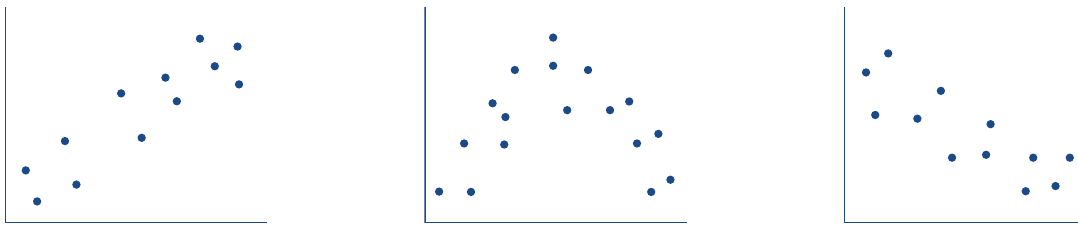
However, when we observe a clear pattern in the arrangement of points, we can identify an association. The scatterplot below shows three different examples where patterns are present, indicating that associations exist in each case.
Pattern Recognition is Key
The ability to distinguish between random scatter and organized patterns is the foundation of scatterplot interpretation. Before describing any relationship, always ask yourself: "Do I see a clear pattern, or are the points scattered randomly?"
Once we have identified that an association exists, we need to describe it using three key features: direction, form, and strength. Understanding these features allows us to communicate clearly about the relationship between variables.
Direction of an association
The direction of an association describes the overall trend of the relationship between the explanatory variable (on the horizontal axis) and the response variable (on the vertical axis).
Positive association
A positive association occurs when both variables tend to increase together. As we move from left to right across the scatterplot, the points trend upwards. This means that higher values of the explanatory variable are associated with higher values of the response variable.
Definition: Positive Association
Two variables have a positive association when the value of the response variable tends to increase as the value of the explanatory variable increases.
Negative association
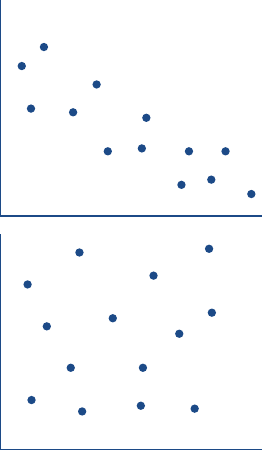
A negative association occurs when the variables move in opposite directions. As we move from left to right across the scatterplot, the points trend downwards. This means that as the explanatory variable increases, the response variable tends to decrease.
Definition: Negative Association
Two variables have a negative association when the value of the response variable tends to decrease as the value of the explanatory variable increases.
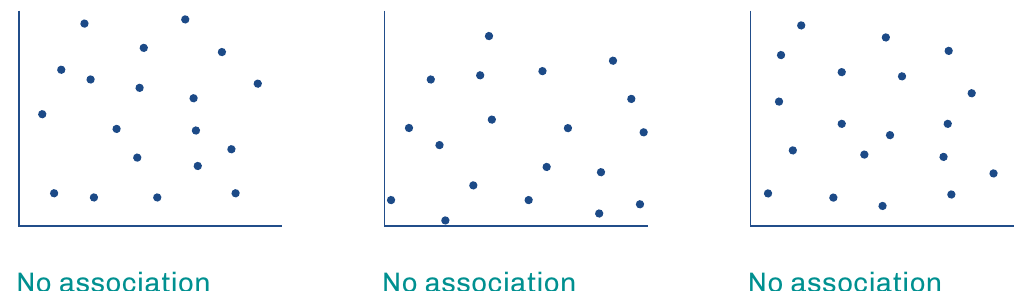
No association
When there is no association, the points show no consistent pattern. They appear randomly scattered across the plot, with no clear upward or downward trend.
Definition: No Association
Two variables have no association when there is no consistent change in the value of the response variable when the value of the explanatory variable increases.
Interpreting direction in context
Once we have identified the direction of an association, we should interpret this in terms of the specific variables being studied. This helps us understand what the relationship means in practical terms.
Worked Example: Interpreting Direction in Context
Consider these real-world scenarios:
- Positive association between height and weight:
- "Individuals who are taller tend to be heavier."
- Negative association between hours of sleep and reaction time:
- "Individuals who have slept fewer hours tend to have slower reaction times."
- No association between height and reaction time:
- "A person's height does not appear to be related to their reaction time."
Notice how each interpretation clearly explains what the association means for the specific variables, making the relationship easier to understand.
Form of an association
The form of an association describes the shape of the pattern formed by the data points. We classify form as either linear or non-linear.
Linear form
A scatterplot has a linear form when the points appear to be scattered around an imaginary straight line. The relationship between the variables can be approximated by a straight line, even though individual points may not fall exactly on that line.
Definition: Linear Form
A scatterplot is said to have a linear form when the points tend to follow a straight line.
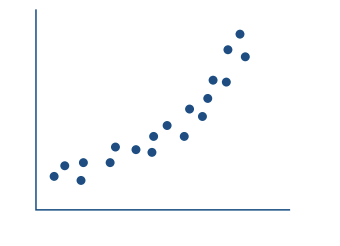
Non-linear form
A scatterplot has a non-linear form when the points appear to be scattered around an imaginary curved line rather than a straight line. The relationship follows a curve, which might be exponential, quadratic, or some other curved pattern.
Definition: Non-linear Form
A scatterplot is said to have a non-linear form when the points tend to follow a curved line.
Why Form Matters
Being able to distinguish between linear and non-linear forms is important because different statistical methods are used to analyse these different types of relationships. Linear relationships are often simpler to analyse and predict.
Strength of an association
The strength of an association measures how closely the points cluster around an imaginary trend line (whether straight or curved). The less scatter there is in the plot, the stronger the association.
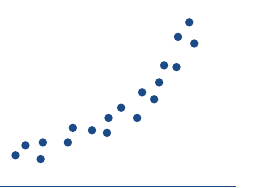
Strong association
When there is a strong association between variables, the points group very closely together around the trend line. The pattern is clearly visible with minimal scatter, making it easy to identify the relationship.
Definition: Strong Association
An association is classified as strong if the points on the scatterplot tend to be tightly clustered about a trend line.
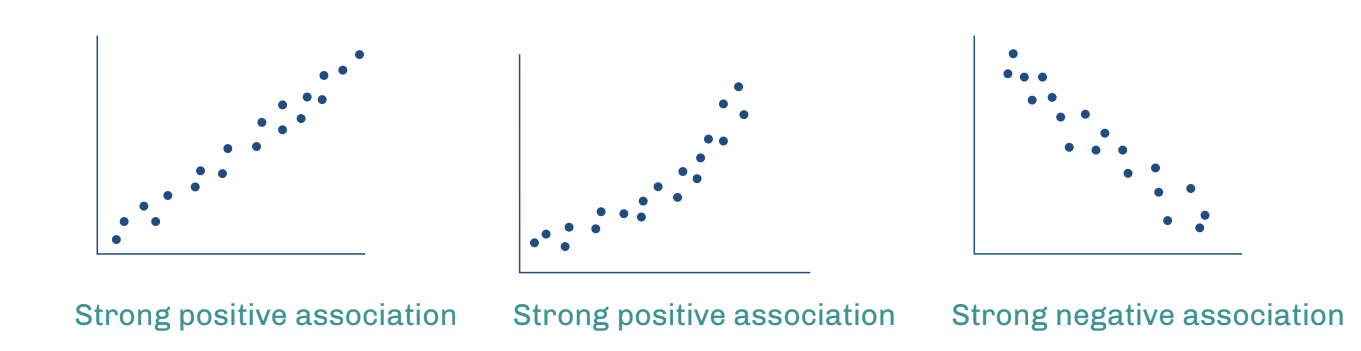
In the examples above, notice how the points form a tight, clear pattern with very little deviation from the overall trend.
Moderate association
When there is a moderate association, the points show more scatter than in a strong association, but a clear pattern is still visible. The points cluster moderately around the trend line.
Definition: Moderate Association
An association is classified as moderate if the points on the scatterplot tend to be moderately clustered about a trend line.
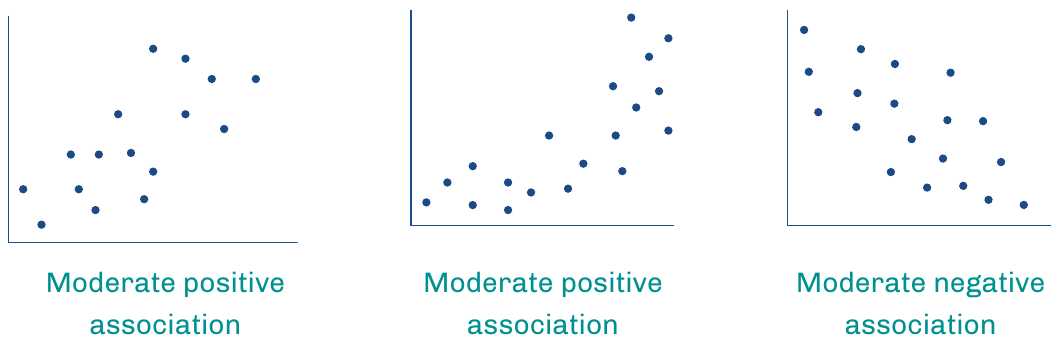
The scatterplots above show examples of moderate associations. While there is more scatter than in strong associations, the overall pattern is still quite apparent.
Weak association
When there is a weak association, the points are loosely scattered around the trend line. A pattern may be barely visible, and there is considerable variation in the data.
Definition: Weak Association
An association is classified as weak if the points on the scatterplot tend to be loosely clustered about a trend line.
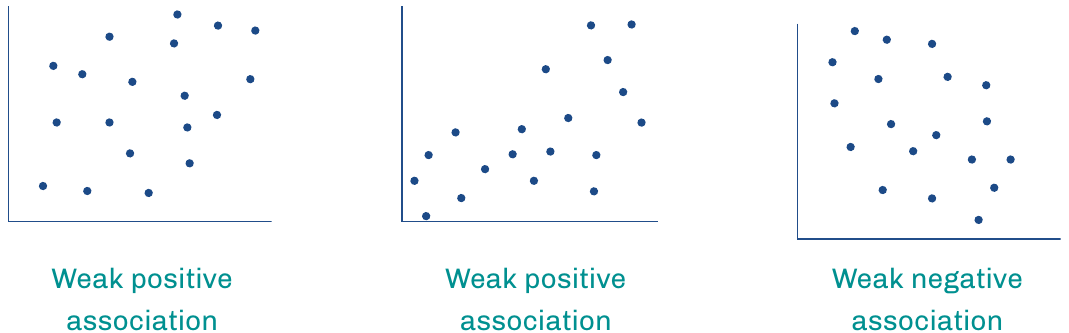
In weak associations, predicting one variable from the other becomes less reliable due to the large amount of scatter.
No association
When there is no association, the points show complete scatter with no discernible pattern at all. In this case, we cannot identify any trend line around which the points cluster.
Measuring Strength Numerically
It's important to note that judging strength by eye can sometimes be challenging. In later topics, you will learn about the correlation coefficient, which provides a numerical value to measure the strength of linear associations more precisely.
Putting it all together
When describing an association in a scatterplot, you should identify all three features:
- Direction: Is it positive, negative, or is there no association?
- Form: Is it linear or non-linear?
- Strength: Is it strong, moderate, or weak?
Worked Example: Complete Description
You might describe a scatterplot as showing:
- "A strong, positive, linear association"
- "A moderate, negative, non-linear association"
Each description gives a complete picture of the relationship by addressing all three key features.
Exam Tip
Always describe all three features when asked to interpret a scatterplot completely. Looking at direction alone gives an incomplete picture of the relationship between variables.
Remember!
Key Points to Remember:
-
Pattern recognition is the first step: look for any clear arrangement of points rather than random scatter
-
Direction describes whether variables increase together (positive), move in opposite directions (negative), or show no consistent relationship (none)
-
Form indicates whether points follow a straight line (linear) or curved line (non-linear) pattern
-
Strength measures how tightly points cluster around a trend line: tight clustering = strong, moderate clustering = moderate, loose clustering = weak
-
Always interpret associations in context by explaining what the relationship means for the specific variables being studied