Interpreting and Predicting From a Linear Model (VCE SSCE General Mathematics): Revision Notes
Interpreting and Predicting From a Linear Model
Understanding slope and intercept in context
When you work with linear regression, you create an equation in the form . This equation doesn't just give you numbers - it tells a story about the relationship between your variables. Learning to interpret the slope and intercept helps you understand what the data is really showing you.
The slope
The slope (represented by in the equation) shows you the rate of change. Specifically, it tells you how much the response variable changes, on average, when the explanatory variable increases by one unit.
For example, if you have the equation:
The slope is 1.62. This means that for each additional hour a student studies, their exam mark increases by an average of 1.62 percentage points.
The intercept
The intercept (represented by in the equation) tells you the expected value of the response variable when the explanatory variable equals zero.
Using the same equation above, the intercept is 30.8. This suggests that a student who does not study at all (time = 0) would obtain an average mark of 30.8%.
The intercept may not always make practical sense, especially when zero is not within your data range. For instance, if you're studying the relationship between height and weight, an intercept suggesting weight when height is zero centimetres wouldn't be meaningful.
Interpreting slope and intercept
For any regression line :
-
The slope represents the average change in the response variable for each one-unit change in the explanatory variable
-
The intercept represents the average value of the response variable when the explanatory variable equals zero
Worked Example: Interpreting slope and intercept
A regression line models the association between study time (in hours) and exam marks (as percentages). The equation is:
Part a: Intercept
The intercept is 30.8.
This tells us that, on average, students who spend no time studying for the examination will obtain a mark of 30.8%.
Part b: Slope
The slope is 1.62.
This tells us that, on average, students' marks increase by 1.62 percentage points for each extra hour of study.
Exam tip: When interpreting slope and intercept, always include:
- The word "average" or "on average"
- The context (what the variables represent)
- The units of measurement
- Whether values are increasing or decreasing
Making predictions using a linear model
Once you have a regression equation, you can use it to make predictions by substituting values for the explanatory variable. However, you need to be careful about whether you're making predictions within or outside your data range.
The study time example
Consider this data showing study time and exam marks for 10 students:

If we fit a linear model using the least squares method, we get the equation:
Using this equation, we can predict marks for different study times:
- For 0 hours:
- For 8 hours:
- For 12 hours:
- For 30 hours:
- For 80 hours:
The last prediction shows a major problem - it's impossible to score 160% on an exam! This highlights why we need to understand the difference between interpolation and extrapolation.
Interpolation and extrapolation
The reliability of predictions from a linear model depends on whether you're predicting within or outside the range of your original data.
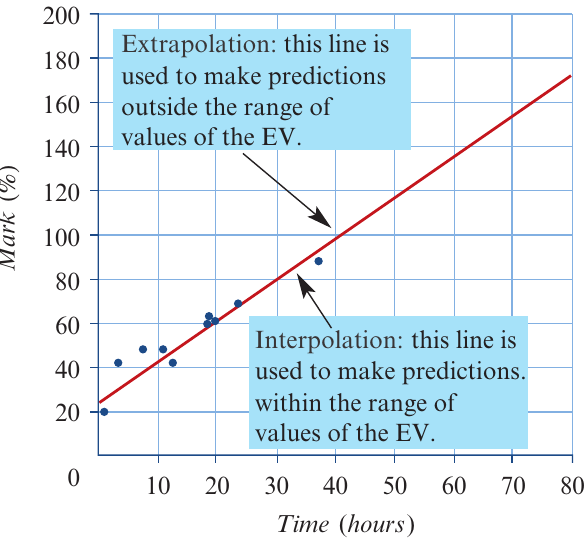
Interpolation
Interpolation means making predictions within the range of values of the explanatory variable that you used to create the regression equation.
In the study time example, students studied between 1 and 36 hours. Any prediction for study time within this range (say, 8, 12, or 30 hours) is interpolation. These predictions are generally reliable because you're working within the data range where you know the linear relationship holds.
Mnemonic: IN-terpolation = IN the data range = reliable
Extrapolation
Extrapolation means making predictions outside the range of values of the explanatory variable.
In the study time example, predicting marks for 80 hours of study is extrapolation because it's well beyond the maximum study time of 36 hours in your data. These predictions are generally unreliable because you don't know if the linear relationship continues outside your data range.
Mnemonic: EX-trapolation = EX-ternal to data range = unreliable
Key differences:
| Interpolation | Extrapolation |
|---|---|
| Predictions within the data range | Predictions outside the data range |
| Generally reliable | Generally unreliable |
| Safe to use | Use with caution |
| Linear relationship is known to hold | Linear relationship may not continue |
Why extrapolation is risky
When you extrapolate, several problems can occur:
- The relationship may no longer be linear outside your data range
- You may get impossible values (like 160% or negative weights)
- You're making assumptions about data you haven't observed
- The model may break down completely
Exam tip: Always check whether a prediction involves interpolation or extrapolation. If extrapolating, note that the prediction is less reliable.
Worked example: Making predictions
Worked Example: Making predictions
The equation relating weights (in kg) and heights (in cm) of students whose heights ranged from 163 cm to 190 cm is:
Part a: Predict weight for height = 170 cm
Substituting 170 into the equation:
This is interpolation because 170 cm is within the range of heights (163 to 190 cm). The prediction is reliable.
Part b: Predict weight for height = 65 cm
Substituting 65 into the equation:
This is impossible - a person cannot have negative weight!
This is extrapolation because 65 cm is well outside the range of heights (163 to 190 cm). The prediction is unreliable and, in this case, completely meaningless.
Steps for making predictions
Follow these steps when making predictions:
- Identify the regression equation
- Note the range of the explanatory variable in your data
- Substitute the value into the equation
- Calculate the predicted value
- Determine if you're interpolating or extrapolating
- Comment on the reliability of your prediction
Key Points to Remember:
- The slope tells you the average change in the response variable for each one-unit change in the explanatory variable
- The intercept tells you the expected value of the response variable when the explanatory variable equals zero (though this may not always be meaningful)
- Interpolation (predicting within your data range) gives reliable predictions
- Extrapolation (predicting outside your data range) gives unreliable predictions and can produce impossible results
- Always check whether your prediction is interpolation or extrapolation, and comment on its reliability